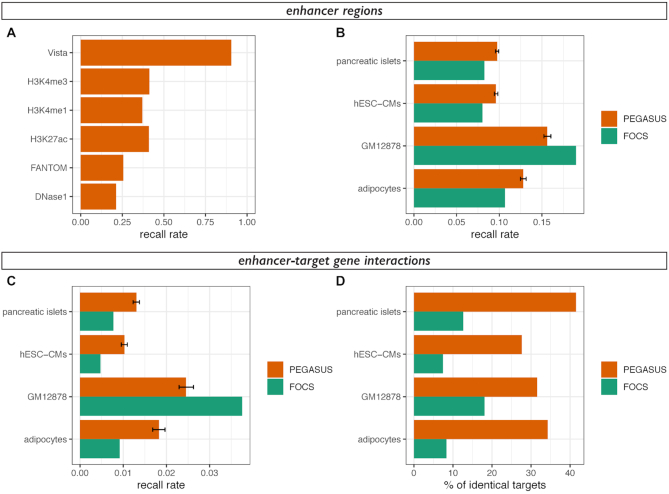
Figure 3.
Overlap between enhancer-target gene prediction methods. (A) Recall rates (1 – false negative rate)for predicted enhancer regions in the human genome. Predicted enhancer regions are the same as in Figure 2. (B) Recall rates for enhancer regions of cHi-C data in adipocytes (20), GM12878 cells (21), embryonic stem cell-derived cardiomyocytes (22) and pancreatic islets (23). Recall rates were computed from PEGASUS enhancers (orange) or FOCS enhancers (25) using the same number of interactions in both sets. Mean recall rates and 2.5–97.5 percentiles (error bar) of 1000 random samplings were plotted for PEGASUS. For each dataset, recall rates for FOCS predictions are significantly different from recall rates for PEGASUS predictions (all P-values < 10−35). (C) Recall rates for enhancer-target gene interactions of cHi-C data in the same cell types as (B). The colour code is identical as (B) and the same number of interactions were used in both sets. Mean recall rates and 2.5–97.5 percentiles (error bar) of 1000 random samplings were plotted for PEGASUS. For each dataset, recall rates for FOCS predictions are significantly different from recall rates for PEGASUS predictions (all P-values < 10−36). (D) Percentage of agreement between in-silico predictions methods (PEGASUS or FOCS) and in-vitro cHi-C interactions, computed as the percentage of one to one overlapping enhancers predicted to target the same gene (see Materials and Methods for more details). We analysed 1755 interactions for pancreatic islets, 1751 interactions for hESC-CMs, 326 interactions for GM12878 cells and 767 interactions for adipocytes.

