Figure 1.

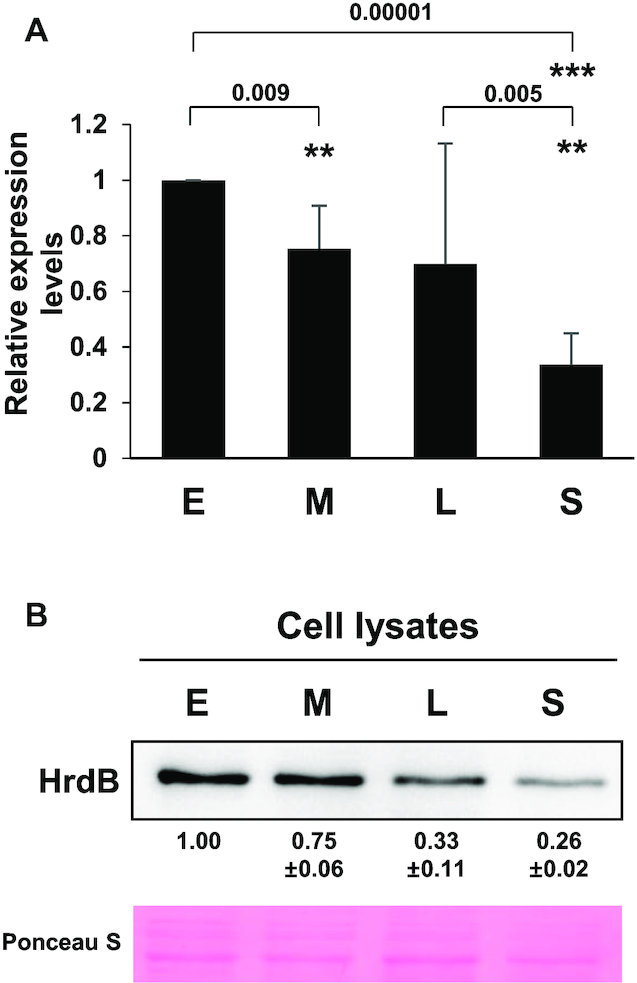
Expression of HrdB during growth. The RNA (A) and protein (B) levels of the hrdB gene expression during the growth of Sven15439. Cells were grown in MYM medium to early- (E), mid- (M) and late- (L) exponential and stationary (S) phases. The hrdB RNA levels were determined by RT-qPCR and presented as the relative values to the level at E phase. The HrdB protein levels from Sven15439 cell lysates (5 μg) were measured by densitometric analyses of the western blots using anti-HrdB antibody. The data represent the average values from independent experiments (n = 4 for RT-qPCR and n = 3 for western analysis), and the standard errors are represented by error bars (A) or values (B). Statistical significance between the groups in A is indicated, based on P values of less than 0.01 (**) or 0.001 (***) by using Student's t-test (n = 4).
