Figure 8.
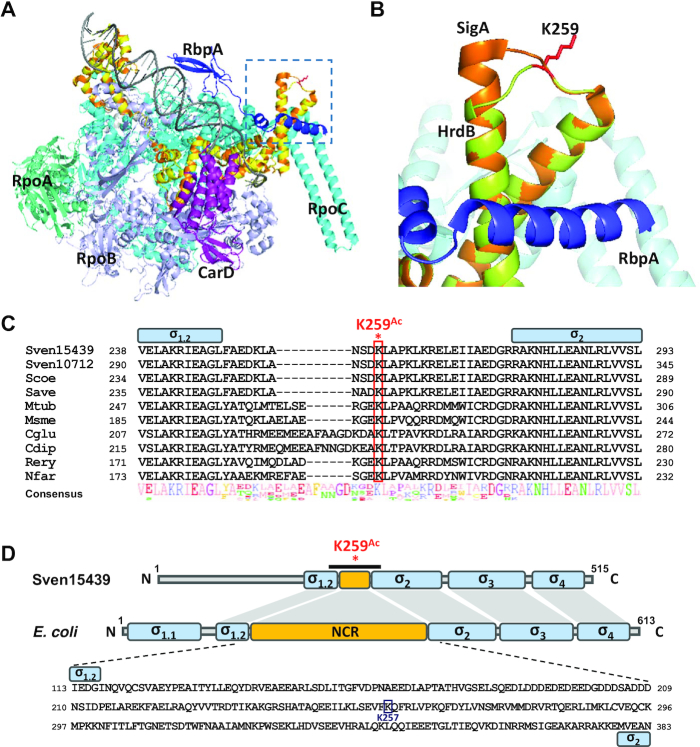
Location and conservation of the K259 residue. (A) Partial structure of the RNAP complex modeled by SWISS-MODEL. The model is based on the structure of the transcription initiation complexes in Mycobacterium smegmatis and Thermus aquaticus from RSC Protein Data Bank (5TW1 and 4XLR) as the template. The Sven15439 HrdB is shown in yellow, which almost overlaps with the SigA (orange) of M. smegmatis. RpoA, RpoB, RpoC, CarD, and RpbA of M. smegmatis are shown in green–cyan, light-purple, cyan, purple and blue, respectively, with DNA in gray. The dotted box denotes the structure containing the K259, as magnified in (B). (B) Location of K259 in the modeled RNAP complex. The K259 residue of HrdB is shown as a red-stick. (C) Sequence alignment of the NCR regions in Actinobacteria. Multiple sequence alignment of the amino acids of the HrdB NCR is shown: Sven15439, S. venezuelae ATCC15439; Sven10712, S. venezuelae ATCC10712; Scoe, S. coelicolor M145; Save, S. avermitilis ATCC31267; Mtub, Mycobacterium tuberculosis H37Rv; Msme, M. smegmatis MC2 155; Cglu, Corynebacterium glutamicum R; Cdip, C. diphtheriae ATCC700971; Rery, Rhodococcus erythropolis PR4; Nfar, Nocardia farcinica IFM10152. The conserved Lys is indicated in red box and NCR in yellow box. (D) Domain similarity of Sven15439 HrdB and E. coli RpoD. Each domain and NCR are shown in blue and yellow boxes, respectively. K259Ac indicates the acetylated residue in the NCR of HrdB. The black bar indicates the region whose sequences are shown in (C). The amino acid sequences of NCR in E. coli are represented with the acetylated residue in the NCR of RpoD indicated.

