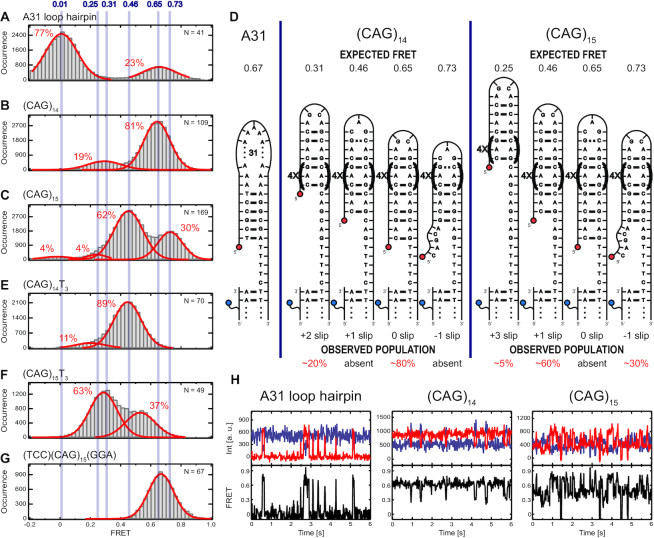
Figure 2.
smFRET analysis and interpretation of A31, (CAG)14 and (CAG)15 hairpin loops, as well as associated hairpin variants. Histograms contain all the timepoints of FRET efficiency from multiple molecules. All the histograms are fit with multiple Gaussian functions (red line) to identify the peak locations. Here we show results for (A) A31; (B) (CAG)14; (C) (CAG)15; (E) (CAG)14T3; (F) (CAG)15T3 and (G) (TCC)(CAG)15(GGA). In (D), we present schematic diagrams to show molecular configurations, expected FRET values (upper edge) and the corresponding observed populations (lower edge) of the individual hairpins. The slip designation is indicated below each schematic. (H) Representative smFRET time traces (upper panels, donor signal in blue, acceptor signal in red) and calculated FRET values (lower panels, black) for A31, (CAG)14 and (CAG)15 hairpin loops.

