
Figure 5.
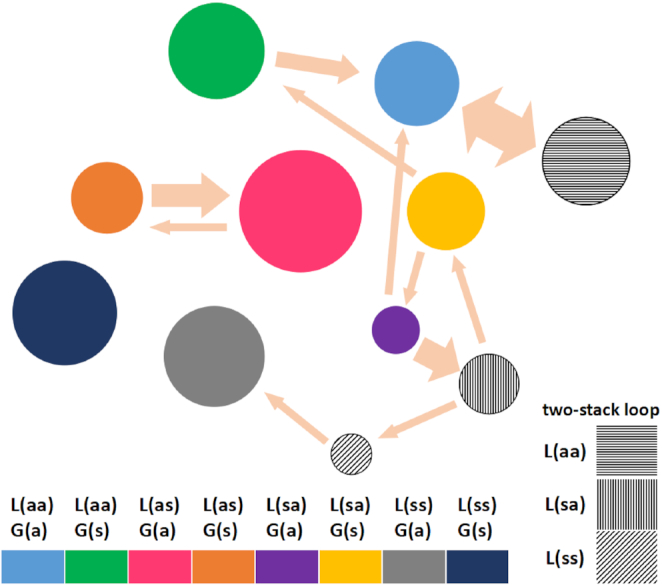
Results for the cluster-like analysis of different conformations for the AGCA tetraloop in the CAG4 hairpin. Different conformations are represented as different colors. Three different kinds of two-stack loops are shown in different shadows. The areas of the circles are representative of the percentage of time that the system spends in that conformation. Likewise the arrows indicate the observed transitions during the simulation with the width of the arrow representing the estimated frequency of transitions. Favorable conformations are indicated by large, growing circles. The simulation results show that the L(as)–G(a) (red; AGCA in anti–anti–anti–syn conformation) and the two versions of L(aa)–G(a) (blue, gray with horizontal line shading; AGCA all in anti conformation) are the most favorable conformations, as discussed in the text.