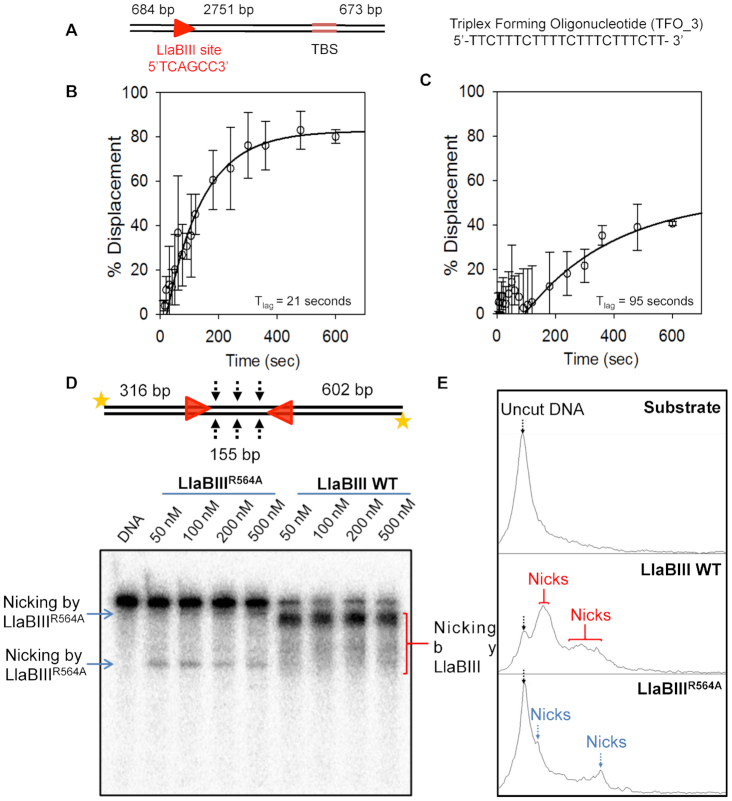
Figure 5.
DNA translocation and nicking activity of LlaBIII and LlaBIIIR564A. (A) Triplex DNA substrate with 2751 bp separation between LlaBIII target sequence and TFO binding site (TBS). Time dependent triplex displacement assay for (B) LlaBIII and (C) LlaBIIIR564A using the above substrate. Hollow circles with error bars shows percentage displacement at different time points. Black solid line shows double exponential fit used to calculate the lag time (Tlag) where data points after 120 seconds were used for the fit. Different time points at which data was collected are 0, 5, 10, 15, 20, 30, 40, 50, 60, 75, 90, 105, 120, 180, 240, 300, 360, 480 and 600 s. (D) Denaturing urea-formamide PAGE showing concentration dependent DNA nicking by LlaBIII and LlaBIIIR564A. 2 nM 1085 bp long 5′-end radiolabeled DNA substrate with a pair of head-to-head oriented target site was used. (E) Densitometry analysis of the nicked products by LlaBIII and LlaBIIIR564A in the PAGE in (D). Black arrow shows the position of the intact DNA (uncut DNA). Red arrows marks the peaks obtained as a result of nicking by LlaBIII, whereas blue arrows marks the positions of the nick product from the LlaBIIIR564A. 4 mM ATP was used in the reaction.

