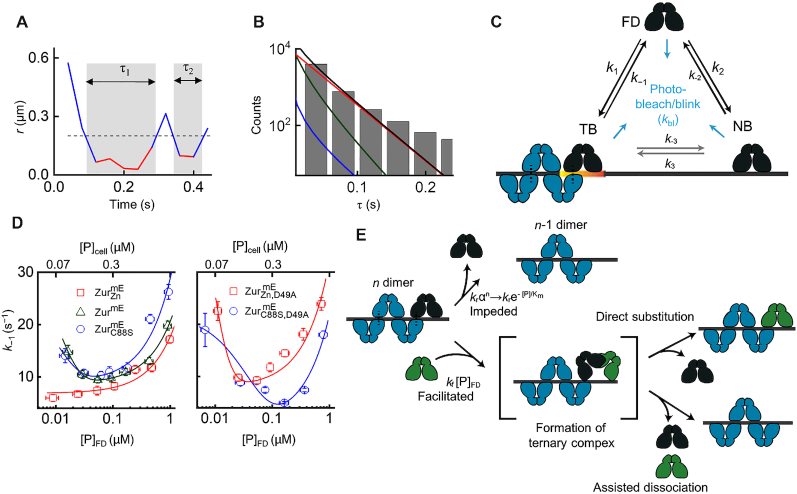
Figure 2.
Biphasic unbinding kinetics of Zur from TB sites on chromosome. (A) Time trajectory of displacement length r per time-lapse from a single  protein. Two microscopic residence time τ shown in gray shades; dashed horizontal line: displacement threshold ro = 0.2 μm (i.e. vertical dashed line in Figure 1B). (B) Histogram of τ for
  at
at  = 290 ± 33 nM. Black line: fitting with Supplementary Equation S15. Contributions of the three diffusion states are plotted, as color-coded in Figure 1B, C. (C) Three-state model of a single Zur protein interacting with DNA in a cell. k’s are the rate constants. (D) Protein-concentration-dependent k−1 for
  , ZurmE, and
  (left) and the D49A salt-bridge mutants (right). Bottom/top axis refers to free/total cellular protein concentration, respectively. Lines are fits with Equation (2). All error bars are s.d. (derived from the goodness of the fit). (E) Schematic molecular mechanism for biphasic unbinding of Zur from a TB site. A bound Zur protein (dark blue) within an oligomer on DNA can unbind following either an impeded pathway (top) due to the presence of the other (n – 1) proteins in the oligomer or a facilitated pathway (bottom) upon binding another protein (green) to form an intermediate ternary complex, which then proceeds through direct substitution or assisted dissociation pathway. Black dashed lines denote salt-bridge interactions.

