Figure 1.
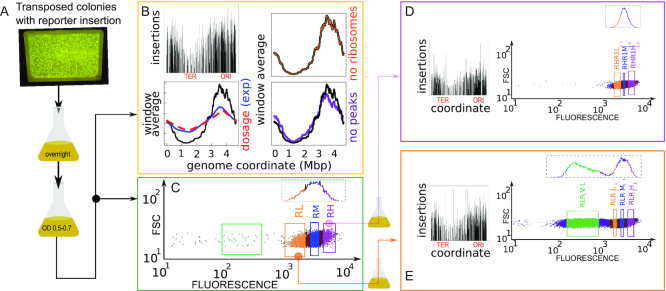
Insertion localization and sorting by gene expression. (A) Experimental pipeline. Massive transposon insertion of a GFP reporter gene cassette in ∼100 000 founder strains was tested by plating on kanamycin-selective agar and PCR. Surviving colonies were mixed, grown overnight in LB, resuspended and grown to a fixed OD. (B) Sequencing of resulting parental populations yields the locations of the insertions, shown in the top-left panel (y axis are counts in logarithmic scale). The bottom panel compares a 3 kb sliding average of the coverage (black line, y-axis rescaled for comparison) with the prediction from gene dosage, and the experimental dosage (red dashed line) measured by whole-genome sequencing (blue line) the right panels are controls that the trend of insertions copy number is not due to ribosomal genes (orange line) and to the insertions with top 10% coverage (>3000 reads/bin, purple line). (C–E) Forward scatter versus GFP expression measured by flow-cytometry. FACS Sorting by the level of fluorescence was performed on a total of four rounds (see Supplementary Figure S1). Selecting for high expression (RH) from the parental population (C) yielded a population with a similar distribution of gene expression (D), while selecting for low expression yielded a population with a bimodal distribution of gene expression (E). Insets in panels (D) and (E) show insertions found by population sequencing (y-axis are counts in logarithmic scale), with overall similarity but local differences.

