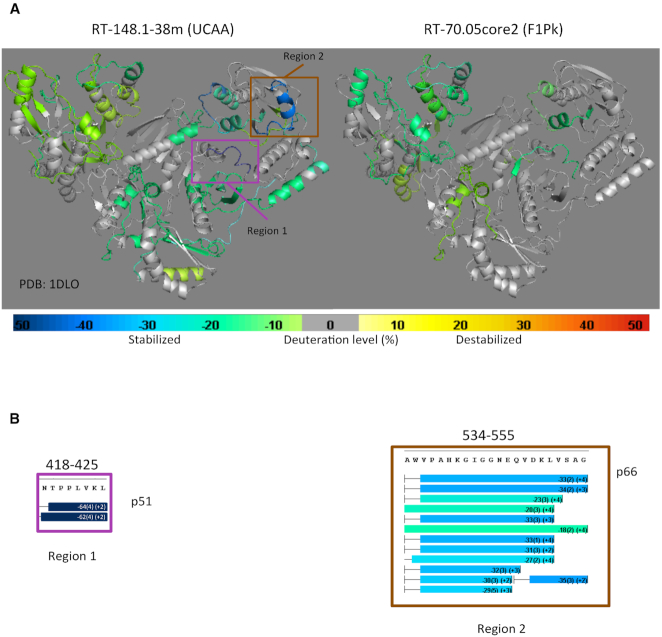
Figure 3.
HDX/MS analysis of RT-148.1-38m (left) versus RT–70.05core2 (right) complexes. (A) The difference in HDX of RT in the presence and absence of the 148.1-38m and 70.05core2 aptamers are mapped onto the crystal structure of ligand-free RT (PDB ID: 1DLO). Change in HDX is color-scaled. Lime green to dark blue indicates decreasing percent deuterium uptake (protection) compared to apo RT. Yellow to bright red represents increasing percent deuterium uptake (exposure). Peptides in gray are those having no net change. (B) Highly protected peptides on RT in the presence of 148.1-38m. When in complex with RT, peptide 418-425 of the p51 subunit (magenta box- Region 1) and peptide 524–555 of the p66 subunit (brown box- Region 2) are strongly protected, especially the 418–425 peptide (dark blue), relative to the remaining regions of RT.

