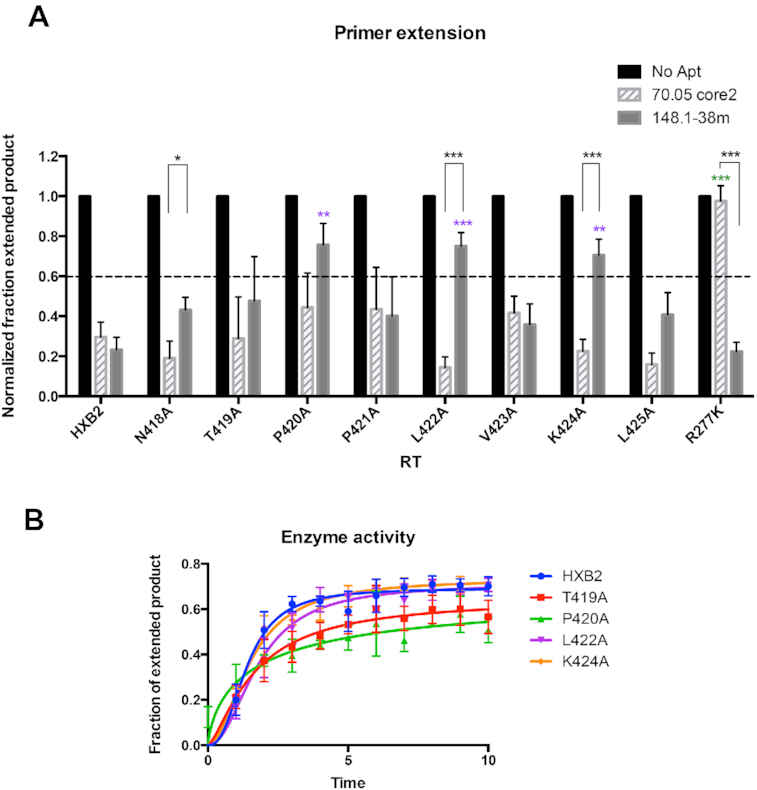
Figure 4.

Alanine-scanning mutagenesis of the 418-NTPPLVKL-425 peptide of p51. (A) Values on the y-axis represent the normalized fraction extended product (NFEP). For each RT-aptamer pair, the fraction of primer converted to full-length product was determined by quantifying band intensities using Multigauge software then normalized to that of RT-No Aptamer. In the absence of aptamer (No Aptamer), the fraction of primers extended to full-length product was the highest. This NFEP value is defined as ‘1.’ In the absence of RT, p/t was not able to extend. Reactions in which the NFEP values were higher than 0.6 were considered to be ‘not inhibitory.’ Values presented on the graphs were the results from three independent experiments. The error bars represent the standard deviation of the NFEP values. Inhibition of mutant RTs by 70.05core2 and 148.1-38m via primer extension assay. R277K is fully resistant to 70.05core2 and was used as control for the assay. Among tested mutants, P420A, L422A and K424A had reduced susceptibility to 148.1-38m inhibition. In contrast, 70.05core2 inhibits all mutants except for R277K. Significant difference between inhibition of 148.1-38m against HXB2 and mutant RT is indicated on top of the specific mutant (purple). Significant difference between inhibition of 70.05core2 against HXB2 and mutant RT is indicated on top of the specific mutant (green). In black is the significant difference between inhibition of 148.1-38m and 70.05core2 against the same mutant RT. * (P < 0.05), ** (P < 0.01), *** (P < 0.001). (B) Enzymatic activity of mutant RTs compared to WT RT (HXB2). Activity was measure by primer extension assay and represented as the fraction of extended product over the time of reaction. Values presented on the graphs were the results from three independent experiments. The error bars represent the standard deviation of the fraction of extended product values.
