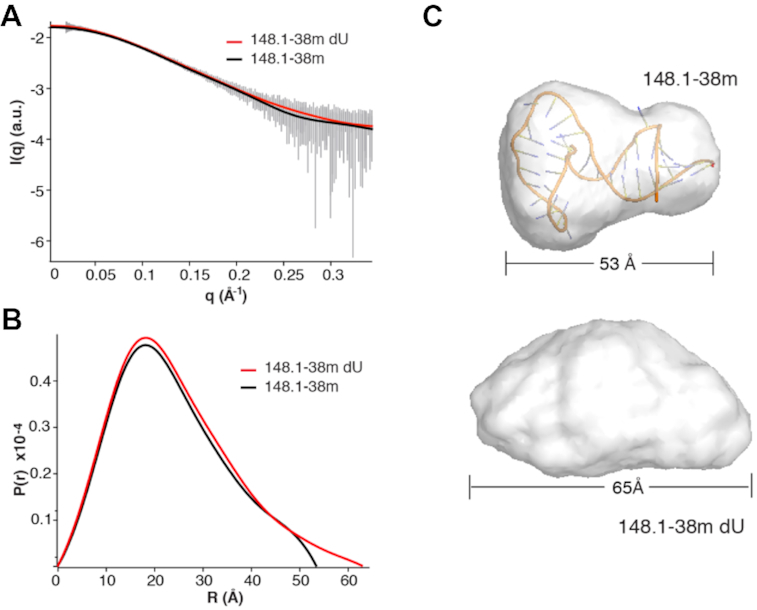
Figure 7.

Deletion of uracil alters SAXS scattering profile. (A) Line of best fit of scattering data. 148.1-38m denoted by black line. 148.1-38m dU denoted by red line. Error bars of averaged scattering data in gray. (B) Pair wise distribution plot of 148.1-38m (black line) and 148.1-38m (red line). (C) Ab initio models of 148.1-38m (top, overlaid with docked conformation of RNA from Figure 8) and 148.1-38m dU (bottom).
