Figure 1.
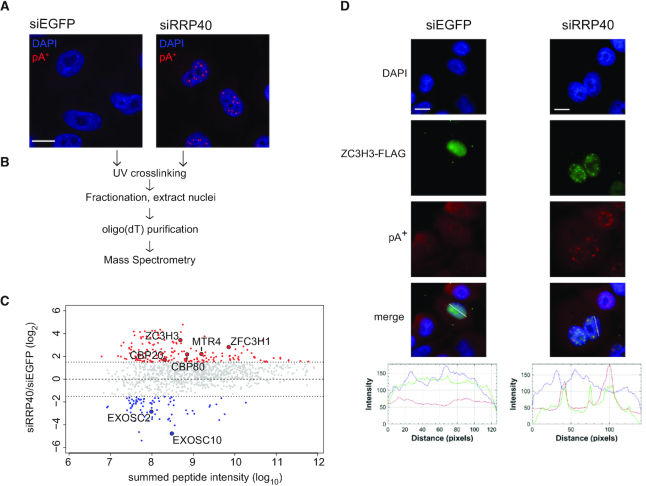
pA+-RNP purification from RRP40-depleted nuclei reveals enrichment of ZC3H3 in pA+ RNA foci. (A) RNA-FISH analysis of pA+ RNA in control (siEGFP) or RRP40-depleted (siRRP40) HeLa cells using a CY3-labeled oligo(dT)-LNA probe (47). pA+ RNA and DAPI signals are shown in red and blue, respectively; scale bar, 10 μm. (B) Schematic representation of the conducted pA+-RNP proteome purification. (C) MA plot representation of differentially purified pA+-RNP factors from RRP40-depleted versus control nuclei. Only proteins detected by 2 or more peptides in one of the samples are shown. Red and blue shadings indicate increased (log2(siRRP40/siEGFP) > 1.5) or decreased (log2(siRRP40/siEGFP) < −1.5) protein signals, respectively. Y-axis: log2(siRRP40/siEGFP), X-axis: log10 summed peptide intensities. Selected upregulated and downregulated proteins mentioned in the main text are highlighted. (D) Co-localization analysis of ZC3H3-FLAG and pA+ RNA in control (siEGFP) or RRP40-depleted (siRRP40) HeLa cells as indicated. ZC3H3-FLAG IF, pA+ RNA-FISH and DAPI stain are shown in green, red and blue, respectively. Line scan profiles represent IF, FISH and DAPI signal intensities along the drawn line shown on the merged picture panels; scale bars, 10 μm.

