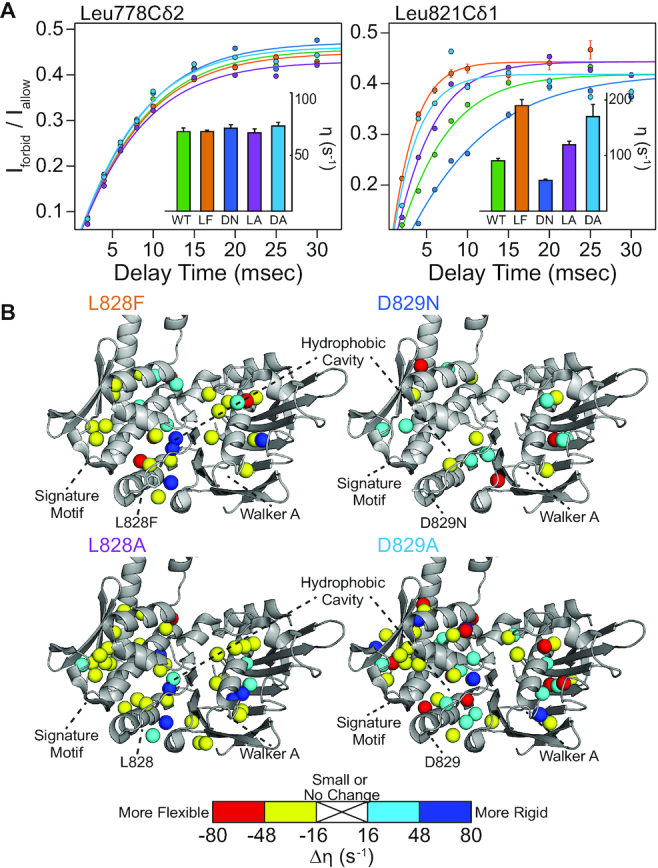
Figure 5.

Mutations to the D-loop alter the dynamic landscape of Rad50 NBD. (A) Representative build up curves for the ratio of intensities (Iforbid/Iallow) from methyl group 1H triple quantum ‘forbidden’ experiments. Data are presented for Leu778Cδ2 (left) and Leu821Cδ1 (right) in wild type (green), L828F (orange), D829N (blue), L828A (purple), and D829A (light blue) (see Supplementary Figure S6 for other curves). Error bars were derived from the noise of the spectra, and solid lines are fits to the experimental data. Insets show bar charts of the calculated intra-methyl 1H–1H dipolar cross-correlated relaxation rate (η). Leu778Cδ2 (left) is a methyl group that does not have a significant change in the amplitude of methyl group dynamics upon mutation. In contrast, Leu821Cδ1 (right) has major changes in flexibility for L828F (decrease) and D829N (increase). (B) Methyl groups experiencing a change of dynamics upon L828F (top left), D829N (top right), L828A (bottom left) and D829A (bottom right) mutation (Δη = ηmut – ηwt) are indicated as spheres on the crystal structure of Rad50 (pdb: 3QKS (15)). Methyl groups with small or no change of dynamics (|Δη| < 16 s−1) are hidden. The color of the sphere indicates the relative dynamics change (see scale under structures).
