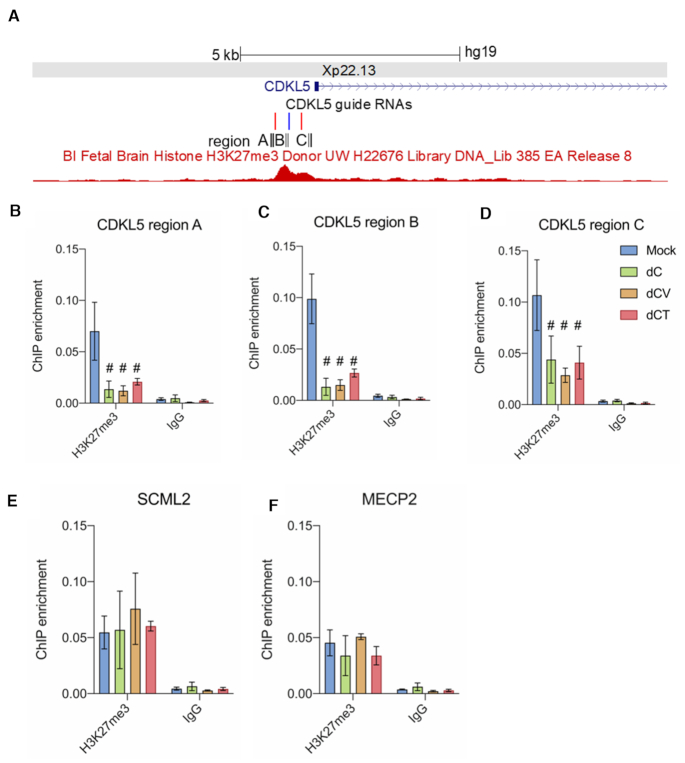
Figure 4.
Depletion of the XCI hallmark histone modification H3K27me3. (A) UCSC genome browser snapshot of the target sites of sgRNAs 1–3 directed against the CDKL5 promoter on Xp22.13 and H3K27me3 peaks derived from ENCODE. Black boxes show the regions assessed by ChIP-qPCR. (B) Input normalized H3K27me enrichment levels determined by ChIP-qPCR in region A of the CDKL5 promoter in mock-treated cells or cells transduced to constitutively express dCas9-no effector (dC) or dCas9 fused to either VP64 (dC-V) or TET1CD (dC-T). (C) Input normalized H3K27me enrichment levels determined by ChIP-qPCR in region B of the CDKL5 promoter. (D) Input normalized H3K27me enrichment levels determined by ChIP-qPCR in region C of the CDKL5 promoter. (E) Input normalized H3K27me enrichment levels determined by ChIP-qPCR in the promoter of the nearest neighboring gene promoter, SCML2. (F) Input normalized H3K27me enrichment levels determined by ChIP-qPCR in the promoter of a distal gene, MECP2, that serves as a negative control. #Significantly different from mock-treated cells, n = 3 independent experiments, P < 0.05.

