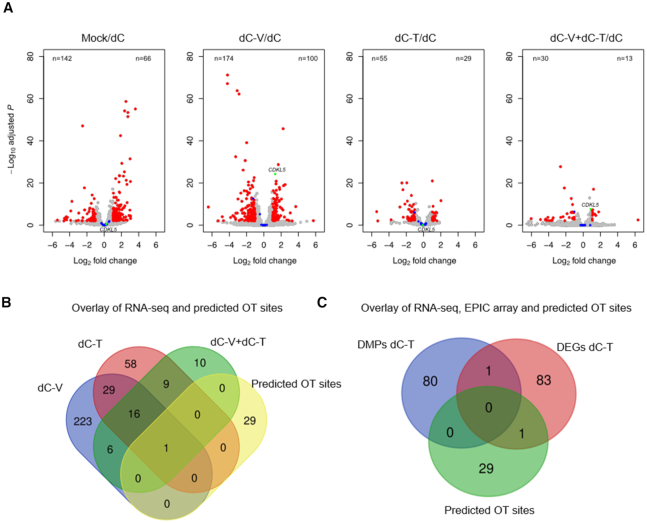
Figure 6.
Off-target analysis of CRISPR/dCas9 effectors by RNA-seq. (A) Volcano plot of significance (FDR adjusted P value) versus fold change for differential DESeq2 expression analysis of mock-treated, dCas9-VP64 (dC-V), dCas9-TET1CD (dC-T) or dCas9-VP64 and dCas9-TET1CD (dC-V+dC-T) guided by sgRNAs 1–3 to the CDKL5 promoter compared to a dCas9-no effector control (dC). Differentially expressed genes are highlighted in red (FDR < 1%, log fold change >1), predicted CRISPR off-target sites are highlighted in blue and the CDKL5 target gene is highlighted in green. The number of downregulated genes is found in the upper left of each panel, the number of upregulated genes is found in the upper right of each panel. (B) Venn diagram showing the overlap of differentially expressed genes between all conditions and the putative off-target list. A single gene, CNTNAP2 is shared between all four groups as a putative off-target. (C) Venn diagram showing the overlap between differentially expressed genes and differentially methylated positions identified in a comparison between dCas9-TET1CD and dCas9 and potential CRISPR off-targets.

