Figure 2.
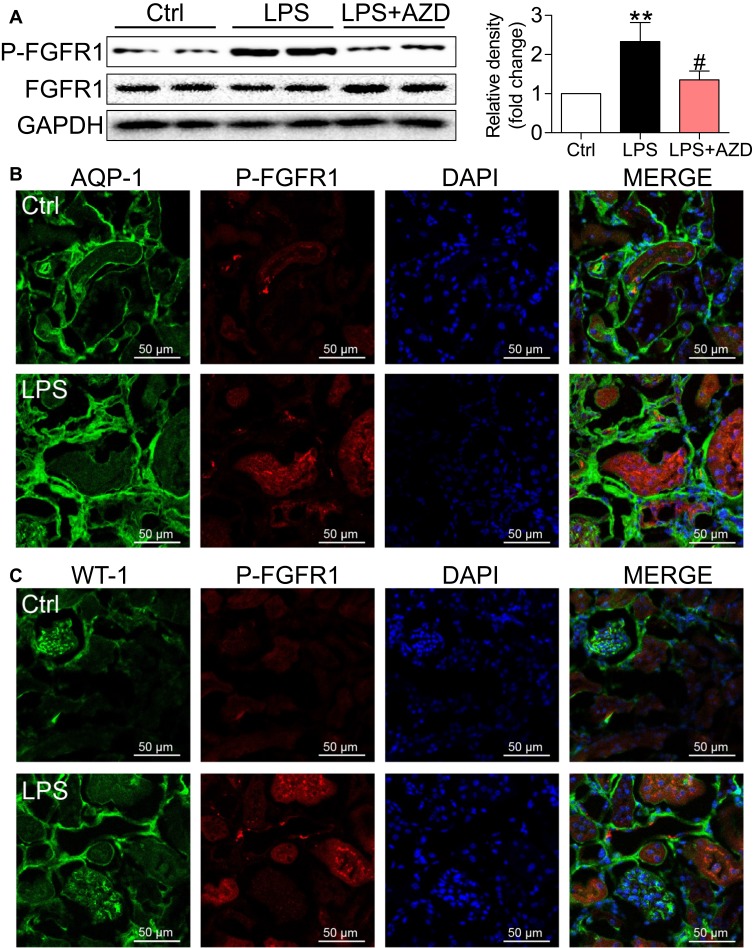
FGFR1 activation is upregulated in kidney tissues in LPS mice. (A) Western blot and densitometric analysis of P-FGFR1 and FGFR1 levels in kidney tissues [n=5 per group; 2 Ctrl, 2 LPS and 2 LPS+AZD samples shown in immunoblots]. (B) Immunofluorescence staining for P-FGFR1 (red) and AQO-1 (green) showing immunoreactivity of P-FGFR1 in tubular epithelial cells [scale bar = 50 μm]. Merged images (yellow) showing colocalization. (C) Immunofluorescence staining of kidney tissues for P-FGFR1 (red) and WT-1 (green) [scale bar = 50 μm]. WT-1 was used as a marker of podocytes. (*, vs Ctrl group; #, vs LPS group; #P<0.05, **P<0.01.)

