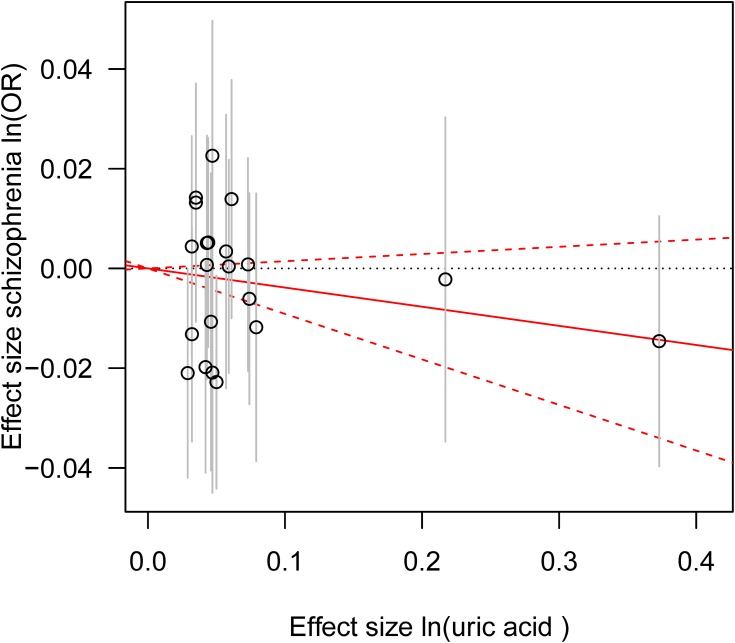
Figure 2.
Genetic risk score GRSUA for schizophrenia.
Notes: The estimated effects on schizophrenia risk (vertical axis) are plotted against the estimated effects on serum UA (horizontal axis). The 95% confidence interval (CI) for each individual UA-associated SNP is shown by vertical grey lines. The estimate of causal effect of serum UA levels on schizophrenia risk is shown by a red solid line with gradient, and 95% CI is denoted by red dashed lines.
Abbreviation: OR, odds ratio.

