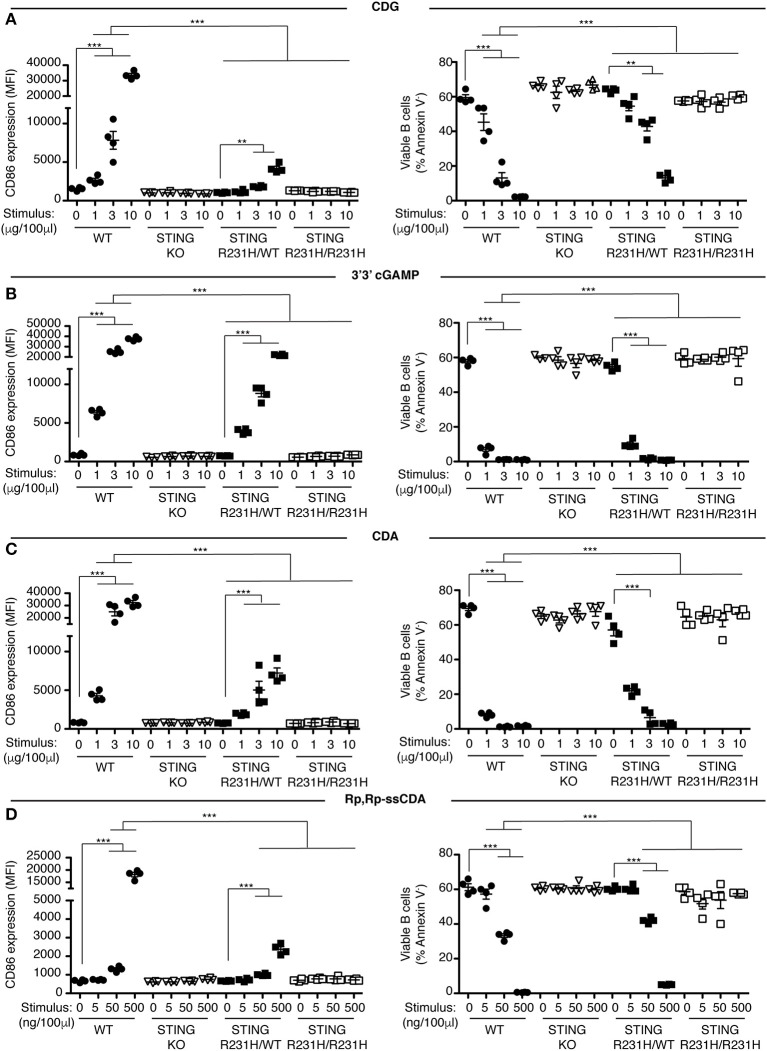
Figure 2.
STING-R231H B cells are impaired in their response to exogenous CDNs. (A–D) WT, STING KO, STING-R231H/WT, and STING-R231H/R231H B cells (n = 4) were cultured for 18 h with the indicated concentrations of exogenous CDNs. CD86 expression (MFI gated on B220+ Annexin V−) is plotted in the left-hand column and B cell survival (% B220+ Annexin V− cells) after stimulation is plotted in the right-hand column. B cells were stimulated with CDG (A), 3′3′ cGAMP (B), CDA (C), and Rp,Rp-ssCDA (D). Data shown are representative of at least two independent replicate experiments. Bars in (A–D) represent mean ± SEM. Statistical comparisons were made for each stimulus concentration and the range of concentrations that reached statistical significance between genotypes are indicated by horizontal lines above the graph. **P < 0.01; ***P < 0.001 using an unpaired Student's t-test.

