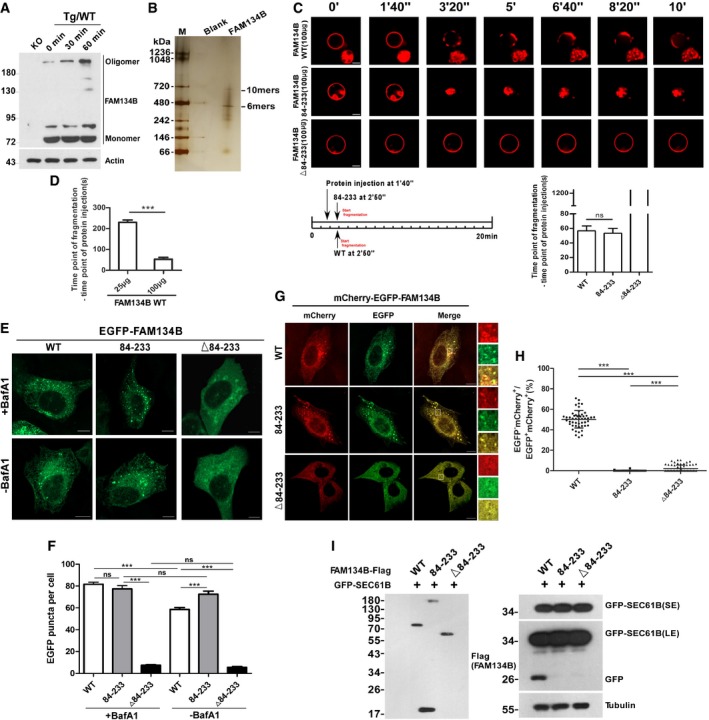
Figure 1. FAM134B forms oligomers that are required for ER membrane scission and ER‐phagy.

-
AEndogenous FAM134B forms oligomers. FAM134B knockout (KO) or wild‐type (WT) 293T cells were treated with 1 μM of Thapsigargin (Tg) for different time, and the cell lysates were prepared and analyzed by Western blot.
-
BAnalysis of the oligomer size of recombinant FAM134B WT using native PAGE.
-
CIn vitro liposome fragmentation assay. After the injection of recombinant proteins (100 μg/100 μl) into the chamber (500 μl), the morphological changes of liposomes were monitored by live imaging for 20 min. The images at different time points as indicated are presented. Scale bars, 10 μm. “ns” means no significance, one‐way ANOVA; error bars indicate SEM (n = 3).
-
DQuantification of the time between protein addition and liposome fragmentation. ***P < 0.001, one‐way ANOVA; error bars indicate SEM (n = 3).
-
E, FMeasurement of the intracellular ER‐scission activity. U2OS cells transiently expressing EGFP‐FAM134B (WT), EGFP‐FAM134B (84–233), or EGFP‐FAM134B (Δ84–233) at same levels, lysosomal degradation of EGFP‐FAM134B was blocked by Bafilomycin A1 (Baf A1) or DMSO. GFP‐positive puncta were quantified for each cell in (F). For each group, at least 30 cells were counted. Scale bars, 10 μm. ***P < 0.001, “ns” means no significance, one‐way ANOVA; error bars indicate SEM.
-
G, HMeasurement of the ER‐phagy activity. U2OS cells transiently expressing mCherry‐EGFP‐FAM134B (WT), mCherry‐EGFP‐FAM134B (84–233), or mCherry‐EGFP‐FAM134B (Δ84–233) at same levels. ER‐phagy is indicated by mCherry‐positive but EGFP‐negative puncta were quantified for each cell in (H). For mCherry‐EGFP‐FAM134B (WT), 50 cells were counted (n = 50); for mCherry‐EGFP‐FAM134B (84–233), n = 56; for mCherry‐EGFP‐FAM134B (Δ84–233), n = 66. Scale bars, 10 μm. The scale bars in the magnification boxes are 2 μm. ***P < 0.001, one‐way ANOVA; error bars indicate SEM.
-
ILysosomal cleavage of GFP was analyzed by Western blot for the cells co‐expressing GFP‐SEC61B and FAM134B WT‐Flag, FAM134B (84–233)‐Flag, or FAM134B (Δ84–233)‐Flag.
Source data are available online for this figure.
