-
A
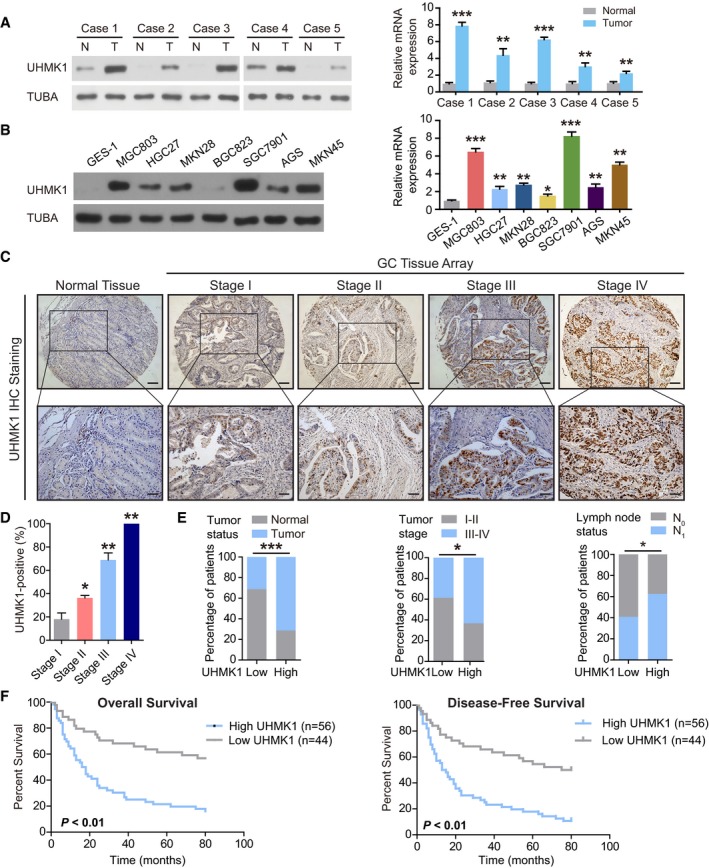
UHMK1 levels in tumor tissues (T) and corresponding nontumor tissues (N) from five GC patients were analyzed using Western blotting and qRT–PCR. The relative mRNA expression of UHMK1 was presented as mean ± standard deviation from three replicates. Pairwise two‐tailed statistical significance was assessed by Student's t‐test.
-
B
Immunoblotting and qRT–PCR were used to measure the levels of UHMK1 in GES‐1 and GC cell lines. The relative mRNA expression of UHMK1 was presented as mean ± standard deviation from three replicates. Pairwise two‐tailed statistical significance was assessed by Student's t‐test.
-
C
IHC analysis of UHMK1 expression in a GC patient tissue array (n = 102). Representative images are shown. Scale bars = 100 μm.
-
D
The IHC signals were scored using the Allred score as described in Material and Methods. Data were shown as mean ± standard deviation from three independent experiments.
-
E
UHMK1 expression in 100 GC patients was analyzed based on the following parameters: tumor stage, tumor status, and lymph node invasion status. Fisher's test was applied to calculate the exact P value.
-
F
Patients with GC were stratified by the UHMK1 level (n = 100); OS and DFS were assessed by Kaplan–Meier analysis.
< 0.001.

