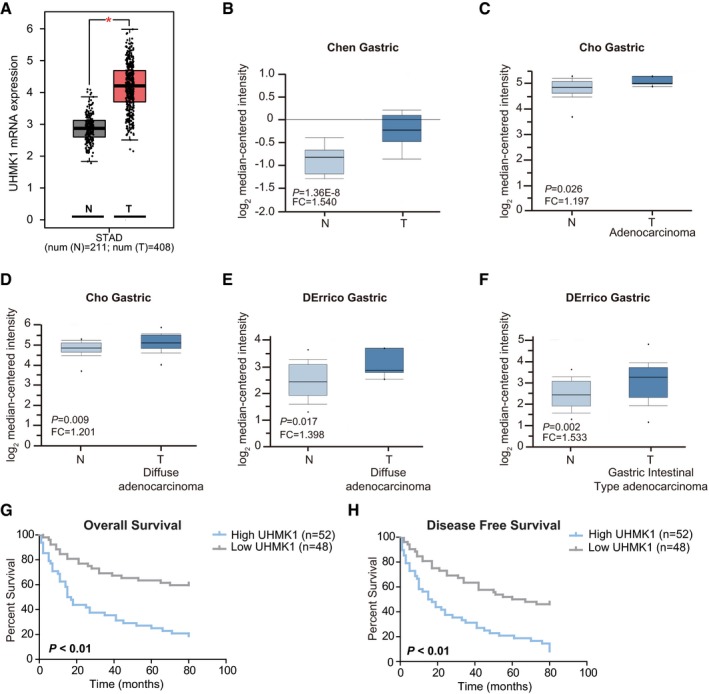
Figure EV1. TCGA and Oncomine analysis of UHMK1 expression in GC patients.

-
ATCGA analyzing the levels of UHMK1 in GC patients. *P < 0.05. The central line stands for the median expression of UHMK1. Upper line stands for upper limit (Upper quartile +1.5 interquartile range). Lower line stands for lower limit (lower quartile –1.5 interquartile range).
-
B–FAnalysis of UHMK1 expression from Oncomine database. The central line stands for the median expression of UHMK1. Upper line stands for upper limit (Upper quartile +1.5 interquartile range). Lower line stands for lower limit (lower quartile –1.5 interquartile range) (three biological replicates).
-
G, HKaplan–Meier analysis from the second independent cohort of GC patients indicated that patients with higher levels of UHMK1 had shorter OS (G) and DFS (H). Survival curves were plotted according to Kaplan–Meier method, with the log‐rank test applied for comparison.
