-
A
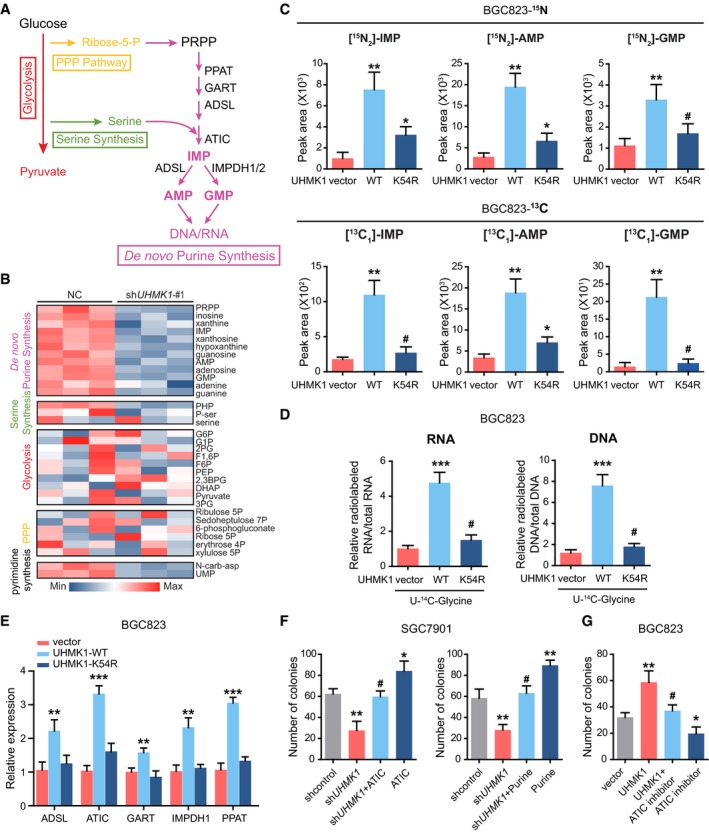
Schematic representation of the main metabolic pathways.
-
B
LC‐MS/MS was used to examine the metabolites in SGC7901 cells with or without UHMK1 knockdown. The data are shown in the heatmap.
-
C
(Upper panel) LC‐MS/MS analysis was performed to measure 15N‐glutamine‐labeled purine synthesis intermediates in BGC823 cells transfected with or without the WT‐UHMK1 or UHMK1‐K54R constructs. (Lower panel) LC‐MS/MS was used to analyze metabolites labeled with 13C‐glycine in BGC823 cells transfected with or without the WT‐UHMK1 or UHMK1‐K54R constructs (three biological replicates).
-
D
RNA and DNA with incorporated 14C‐glycine in BGC823 cells transfected with or without the WT‐UHMK1 or UHMK1‐K54R constructs were examined using LC‐MS/MS (three biological replicates).
-
E
qRT–PCR assays were used to analyze the effects of WT‐UHMK1 or UHMK1‐K54R on the genes controlling purine metabolism. Data were presented as mean ± standard deviation from three replicates. Unpaired two‐tailed statistical significance was assessed by Student's t‐test.
-
F
UHMK1 silencing significantly decreased SGC7901 cell proliferation, while ATIC overexpression or purine supplementation markedly reversed this inhibition. Data were presented as mean ± standard deviation from three replicates. Unpaired two‐tailed statistical significance was assessed by Student's t‐test.
-
G
Treatment with the ATIC inhibitor significantly reversed the proliferation of BGC823 cells induced by UHMK1 overexpression. Data were presented as mean ± standard deviation from three replicates. Unpaired two‐tailed statistical significance was assessed by Student's t‐test.
< 0.001, # marked no significance.

