-
A
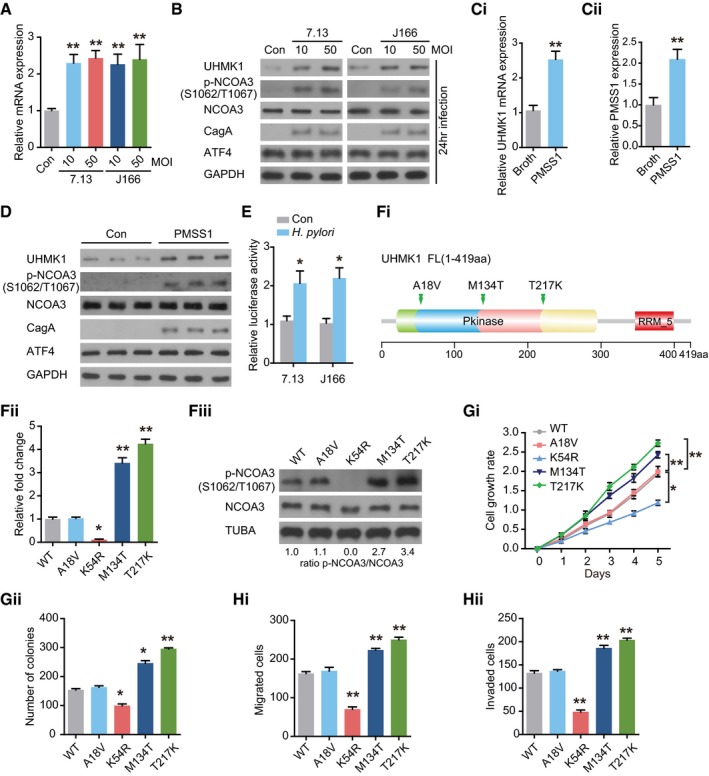
qRT–PCR was performed to analyze UHMK1 expression in BGC823 cells infected with or without H. pylori CagA
+ strains 7.13 and J166. MOI, multiplicity of infection. Data were presented as mean ± standard deviation from three replicates.
-
B
Immunoblotting of UHMK1, NCOA3 phosphorylated at S1062/T1067, NCOA3, and ATF4 in the samples from (A).
-
C
PMSS1, a H. pylori strain, was used to challenge mice orogastrically, with Brucella broth as the control. qRT–PCR was performed to measure UHMK1 (Ci) and PMSS1(Cii) expression in gastric tissues. Data were presented as mean ± standard deviation from three replicates.
-
D
Immunoblotting of UHMK1, NCOA3 phosphorylated at S1062/T1067, NCOA3, and ATF4 in the samples from (C).
-
E
An ATF4 luciferase reporter assay was carried out in BGC823 cells with or without H. pylori infection. Data were presented as mean ± standard deviation from three replicates.
-
F
(Fi) The domain architecture of UHMK1 and the positions of human GC‐associated mutations. (Fii and Fiii) IP kinase assay. Briefly, UHMK1 from HEK293 cells expressing WT‐UHMK1 or its mutants was immunoprecipitated with anti‐HA antibodies. The immunoprecipitated proteins were mixed with a synthetic peptide of the CATS protein (a known substrate of UHMK1) and [32P] ATP. A phosphocellulose paper assay was used to measure kinase activity. The results were normalized to a value of 1.0 for WT‐UHMK1(three biological replicates).
-
G
The effects of human GC‐associated UHMK1 mutations on the proliferation and colony formation of GC cells (three biological replicates).
-
H
The effects of human GC‐associated UHMK1 mutations on GC cell invasion and migration (three biological replicates).
Data information: Unpaired two‐tailed statistical significance was assessed by Student's
‐test. Data represent mean ± SD. *
< 0.01.

