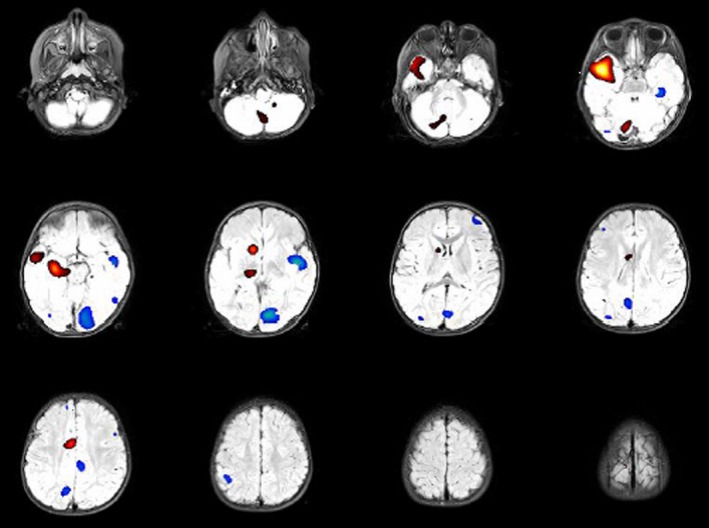
Figure 1.

Subtraction ictal SPECT coregistered to MRI (SISCOM) imaging. Relative ictal hyperperfusion (+2 to +4 SD) is identified in red‐yellow, while the relative ictal hypoperfusion zones are colored in blue (−2 to −4 SD). Notice the localized zone of relative hyperperfusion in the right anteromesial temporal lobe (yellow), with propagation to the superior lateral temporal neocortex (red), while the contralateral anteromesial temporal lobe shows a light hypoperfusion (light‐blue). The patient reached complete seizure freedom after resective surgery, which confirmed the presence of a focal cortical dysplasia type IIA in the right anterior temporal lobe (patient #39)
