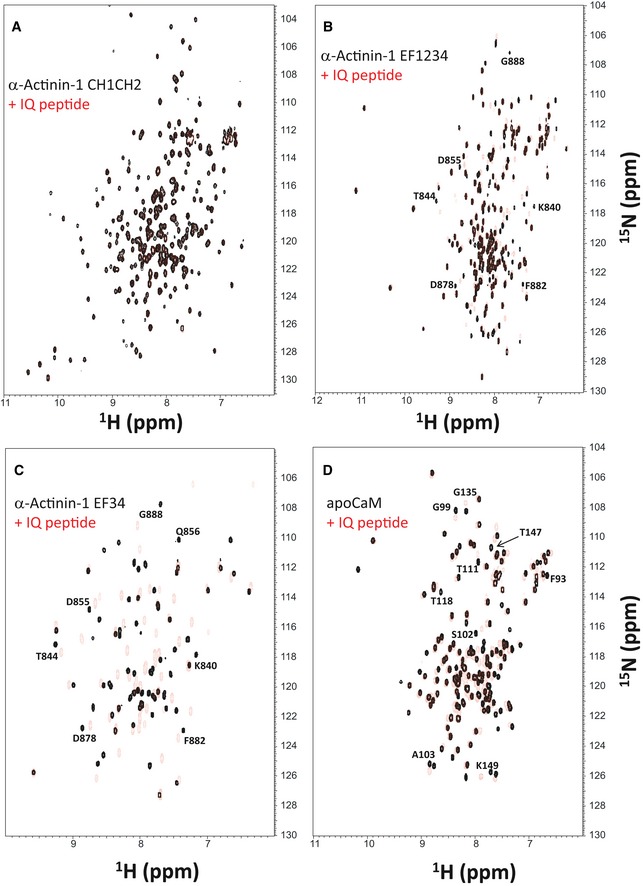
Figure EV1. Mapping the CaV1.2 IQ binding site in α‐actinin and apoCaM.

- Overlay of 15N‐1H HSQC spectra of 15N‐labeled α‐actinin‐1 CH1/CH2 domain (residues 19–192) by itself (black peaks) and after addition of saturating, unlabeled IQ peptide (red peaks).
- Overlay of 15N‐1H HSQC spectra of 15N‐labeled α‐actinin‐1 EF‐hand domain (residues 750–892) by itself (black peaks) and after addition of saturating, unlabeled IQ peptide (red peaks).
- Overlay of 15N‐1H HSQC spectra of 15N‐labeled α‐actinin‐1 C‐lobe (α‐actinin‐1 EF34; residues 822–892) by itself (black peaks) and after addition of saturating, unlabeled IQ peptide (red peaks).
- Overlay of 15N‐1H HSQC spectra of 15N‐labeled apoCaM by itself (black peaks) and after addition of saturating, unlabeled IQ peptide (red peaks).
