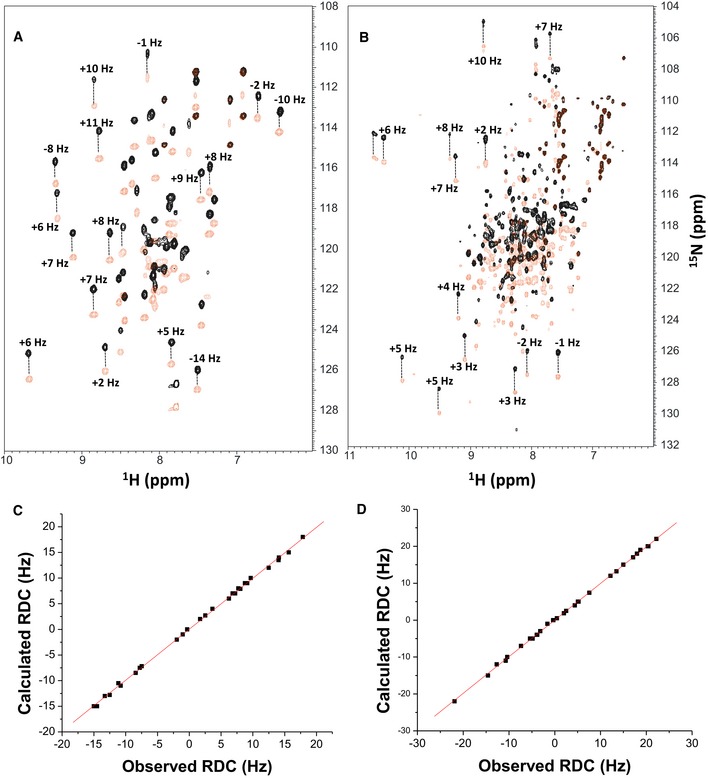
15N‐
1H HSQC‐IPAP spectra (Tjandra & Bax,
1997) of
15N‐labeled α‐actinin‐1_EF34 (A) or apoCaM (B) in the presence of saturating unlabeled IQ peptide. Representative and measured RDC values are marked above‐selected peaks. Samples used in HSQC‐IPAP experiments were prepared by adding 5 mg of
15N‐labeled protein to 0.5 ml of NMR buffer containing 12 mg/ml of filamentous bacteriophage Pf1. HSQC‐IPAP spectra were recorded in the presence of Pf1 (A, B) and absence of Pf1 (not shown). Residual dipolar couplings (RDCs) were measured (in Hz) as the difference in splitting for the
15N‐[
1H] doublet components relative to the isotropic
1J
NH coupling. RDCs measured for 34 residues (α‐actinin‐1_EF34/IQ) and 36 residues (apoCaM/IQ) served as orientational structural restraints applied during the refinement phase of the structure calculation (Schwieters
et al,
2003).

