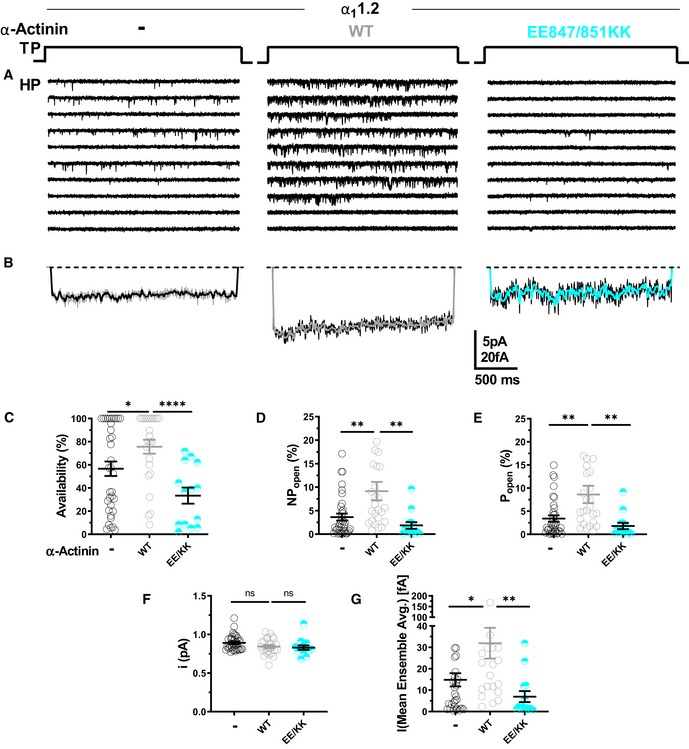
Figure 4. Ectopic α‐actinin‐1 expression increases CaV1.2 open probability.

-
ARepresentative single CaV1.2 channel recordings of WT CaV1.2 alone or with WT or E847K/E851K mutant α‐actinin‐1.
-
BMean assemble averages for all experiments for each combination.
-
C–GDot plots and means ± SEM for availability (C), NPo (D), Po (E), unitary current amplitude i (F), and the mean of the current of a single channel calculated from the ensemble averages of each experiment (G) (*P < 0.05, **P < 0.01, ****P < 0.001; unpaired t‐test; n = 13–35; see Table 6 for more details).
