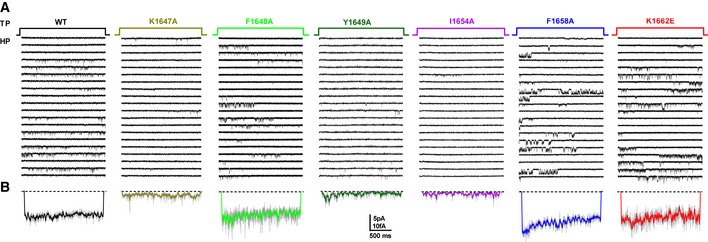
Figure EV4. Representative single‐channel traces for CaV1.2 WT, K1647A, F1648A, Y1649A, I1654A, F1658A, and K1662E.

-
A, BHolding potential (HP) was −80 mV and test potential (TP) 0 mV. Shown are 20 consecutive sweeps from representative experiments (A) and mean assemble average currents (B) for all experiments for CaV1.2 WT and each mutant.
