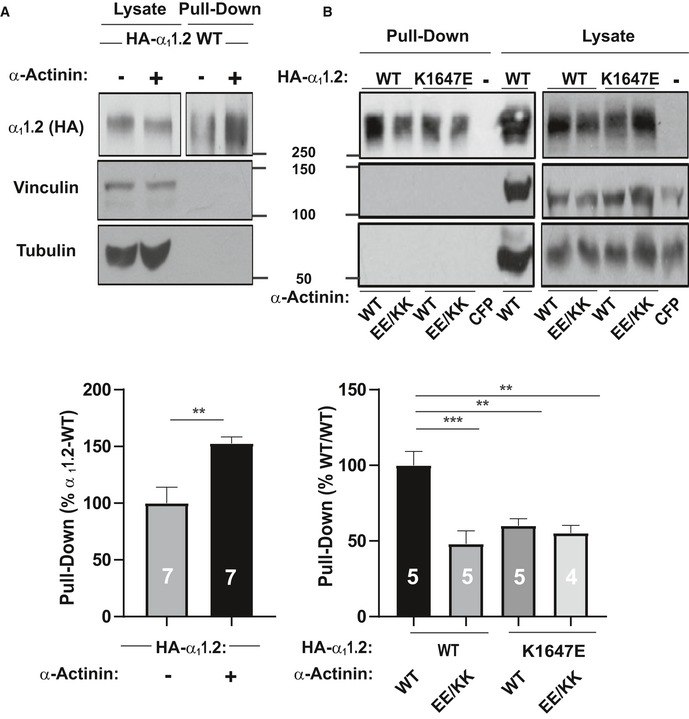
HEK293 cells were transfected with WT α
11.2, α
2δ‐1, and β
2A ± WT α‐actinin‐1 and cultured for 22–24 h before surface biotinylation. Shown are representative immunoblots of NeutrAvidin pull‐down samples (from lysate containing 600 μg protein) and total lysate samples containing 20 μg protein. α
11.2 was detected with an antibody against its HA tag (
top), which is present in all constructs used throughout this work. Pull‐down and lysate samples are from the same blot but different exposures because signals from lysate samples were much stronger than from pull‐down samples. Immunoblotting for vinculin (
middle) and tubulin (
bottom) indicated that comparable amounts of these intracellular control proteins were present in lysate samples. Their absence in pull‐down samples as seen on the same blots showed that these prominent intracellular proteins did not undergo biotinylation as control for membrane integrity during surface biotinylation. Bar graph shows means ± SEM of the pull‐down immunosignals in mutants relative to surface labeling of control α
11.2 samples lacking α‐actinin‐1 co‐expression (mean set to 100%; see
Materials and Methods; **
P < 0.01 two‐tailed
t‐test;
n = 7).

