-
A
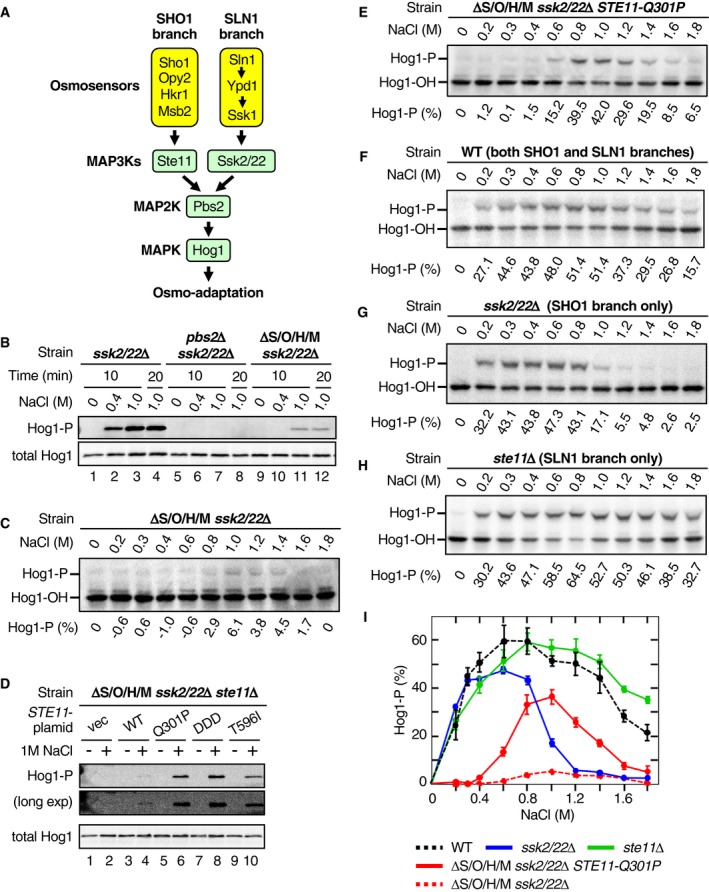
A schematic diagram of the Hog1 MAPK signaling pathway.
-
B
Analyses of Hog1 phosphorylation by immunoblotting with anti‐phospho‐p38 (Hog1‐P) and anti‐Hog1 (total Hog1) antibodies. Cells of the indicated genotypes were stimulated with the indicated concentrations of NaCl for the indicated time. Strains used are TM257, KT207, and KY594‐1.
-
C
Analyses of Hog1 phosphorylation by Phos‐tag band‐shift assay. Yeast strain KY594‐1 was stimulated with the indicated concentrations of NaCl for 5 min. The percentages of phosphorylated Hog1 (Hog1‐P [%]) were calculated as explained in Materials and Methods and are shown beneath the panel.
-
D
Analyses of Hog1 phosphorylation by immunoblotting with anti‐phospho‐p38 (Hog1‐P) and anti‐Hog1 (total Hog1) antibodies. Yeast strain KT219 was transformed with the indicated STE11 mutant gene carried by a single‐copy plasmid that is expressed from the STE11 promoter: vec, vector; WT, wild‐type; DDD, S281D/S285D/T286D. Cells were incubated with (+) or without (−) 1 M NaCl for 5 min.
-
E–H
Analyses of Hog1 phosphorylation by Phos‐tag band‐shift assay. Yeast strains (E) KY603‐3; (F) TM142; (G) TM257; and (H) FP54 were stimulated with the indicated concentrations of NaCl for 5 min.
-
I
Comparison of the NaCl dose–responses of Hog1 activation by various strains. Phos‐tag band‐shift assays shown in (C and E–H) were independently repeated three times, and average values were plotted.
Data information: (C and E–H) Representative results from three independent experiments. (I) Error bars are SEM (
= 3).

