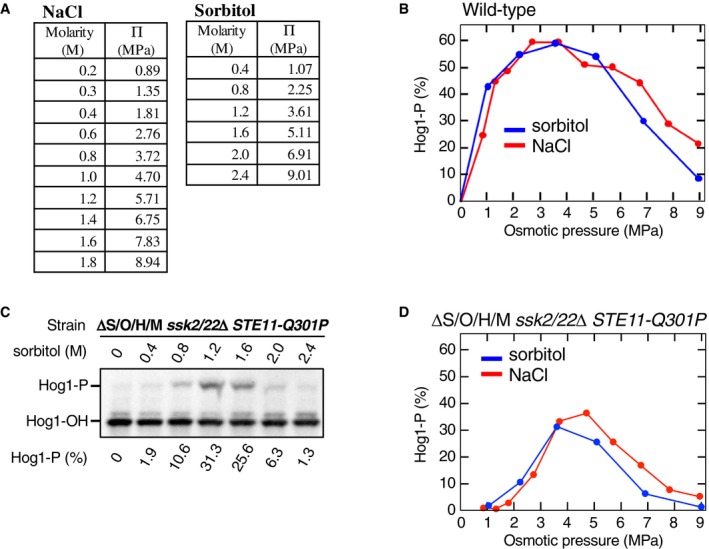
Figure EV1. The “downstream osmosensor” responds to osmostress regardless of the type of osmostressor.

- Conversion of NaCl and sorbitol solute concentration (molarity, M) to osmotic pressure Π (mega pascal, MPa). For more detail, see the Appendix Fig S1.
- Comparison of Hog1 phosphorylation induced by NaCl and sorbitol. The yeast strain TM142 (WT) was stimulated with various concentrations of NaCl or sorbitol for 5 min, and the percentage of Hog1‐P was determined using a Phos‐tag band‐shift assay. Solution molar concentrations were converted to the corresponding osmotic pressures (MPa) using the table in (A).
- Phos‐tag band‐shift analyses of sorbitol‐induced Hog1 phosphorylation. The yeast strain KY603‐3 (ΔS/O/H/M ssk2/22Δ STE11‐Q301P) was stimulated with the indicated concentrations of sorbitol for 5 min.
- Same as in (B), except that the yeast strain KY603‐3 (ΔS/O/H/M ssk2/22Δ STE11‐Q301P) was used.
Source data are available online for this figure.
