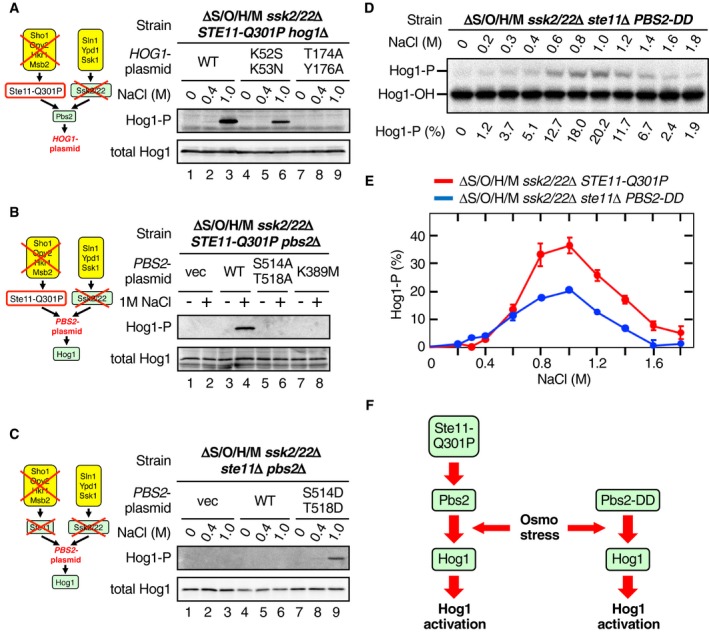
Figure 2. Osmostress enhances the phosphorylation of Hog1 by Pbs2.

-
A–CImmunoblot analyses of Hog1 phosphorylation. Yeast strains (A) KT235; (B) KT209; and (C) KT234 were stimulated with the indicated concentrations of NaCl for 10 min, and phosphorylated Hog1 (Hog1‐P) and total Hog1 in cell lysates were detected by immunoblotting. The relevant genotypes of the strains are indicated in the top row of each panel and are schematically shown in the diagrams at left. The second row from the top indicates the genes carried by a single‐copy plasmid that are expressed from their own promoters. vec, vector; WT, wild‐type.
-
DPhos‐tag band‐shift analyses of Hog1 phosphorylation. The yeast strain KT234 carrying the single‐copy expression plasmid YCplac22I’‐Pbs2 S514D/T518D was stimulated with the indicated concentrations of NaCl for 5 min.
-
EComparison of the NaCl dose–responses of Hog1 activation by constitutively active Ste11‐Q301P and constitutively active Pbs2‐DD. Phos‐tag band‐shift assays shown in (D) and Fig 1E were independently repeated three times, and the average values were plotted.
-
FA scheme illustrating the step in the Hog1 MAPK cascade at which osmostress acts to enhance Hog1 phosphorylation.
