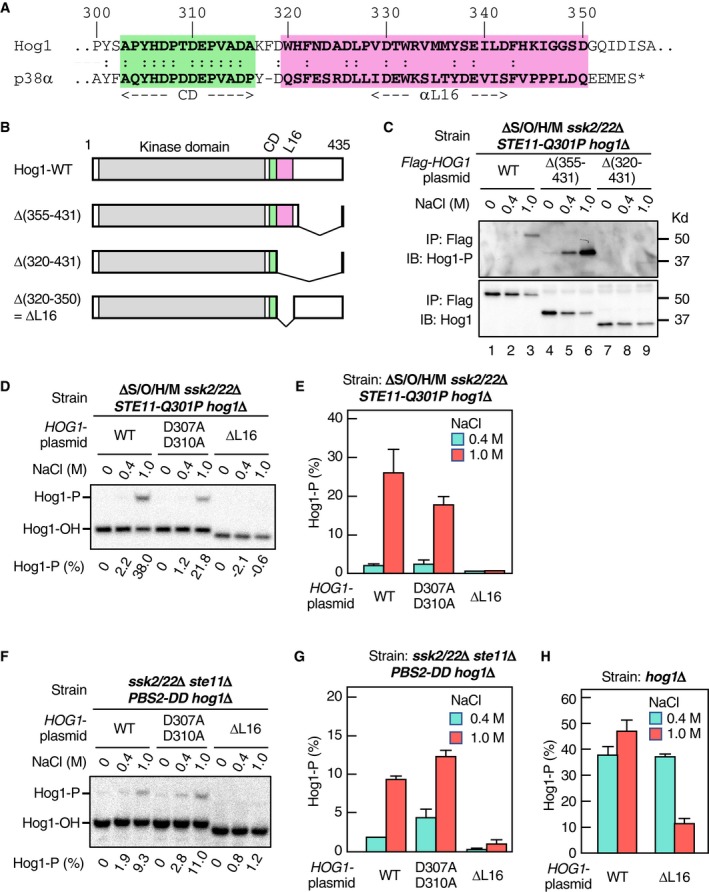
Figure 3. The Hog1 L16 domain is required for the osmotic enhancement of the Pbs2‐Hog1 reaction.

-
AAlignment of the amino acid sequences of the CD (green) and L16 (pink) domains of yeast Hog1 and mammalian p38α. The alpha helix αL16 forms the core of the L16 domain (Wang et al, 1997).
-
BSchematic diagrams of Hog1‐WT and its deletion constructs used in this study.
-
CImmunoblot analyses of Hog1 phosphorylation. The yeast strain KT235 was transformed with pRS416‐FLAG‐Hog1 (WT) or its indicated deletion derivatives. FLAG‐Hog1 was immunoprecipitated (IP), and immunoblotted (IB) with anti‐phospho‐p38 (for Hog1‐P; upper panel) or anti‐FLAG (for total FLAG‐Hog1; lower panel)
-
D–GPhos‐tag band‐shift assay of Hog1 phosphorylation. Yeast strain (D and E) KT235 or (F and G) KT290 carrying the single‐copy expression plasmid YCplac22I’‐Pbs2 S514D/T518D was transformed with either pRS416‐Hog1 (WT) or its indicated mutant derivatives and was treated with the indicated concentrations of NaCl for 5 min. (D) and (F) show typical results, and (E) and (G) summarize the averages of three independent experiments.
-
HPhos‐tag band‐shift assay of Hog1 phosphorylation. The yeast strain FP4 was transformed with the single‐copy expression plasmid pRS416‐Hog1 (WT) or pRS416‐Hog1‐ΔL16 and was treated with the indicated concentrations of NaCl for 5 min. The averages of three independent experiments are shown.
