-
A
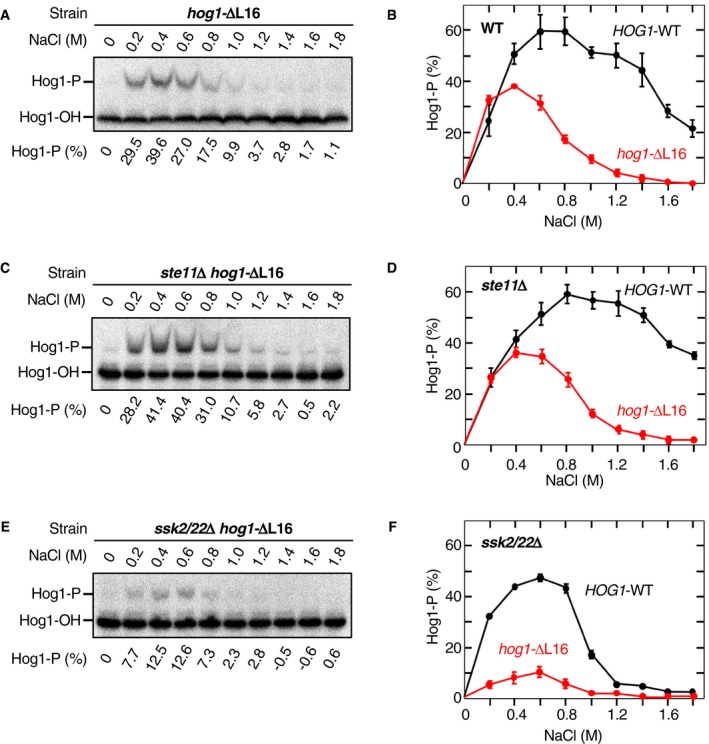
Phos‐tag band‐shift analyses of osmostress‐induced Hog1 phosphorylation. The yeast strain FP4 (hog1Δ) was transformed with the single‐copy expression plasmid pRS416‐Hog1‐ΔL16 and was stimulated with the indicated concentrations of NaCl for 5 min.
-
B
Averages of three independent experiments from A were plotted. Results for Hog1‐WT (from Fig
1I) are included for comparison.
-
C, D
Same as in (A and B), except that the yeast strain KT259 (ste11Δ hog1Δ) was used.
-
E, F
Same as in (A and B), except that the yeast strain KY523 (ssk2/22Δ hog1Δ) was used.
Data information: (A, C, and E) Representative results from three independent experiments. (B, D, and F) Error bars are SEM (
n = 3).
Source data are available online for this figure.

