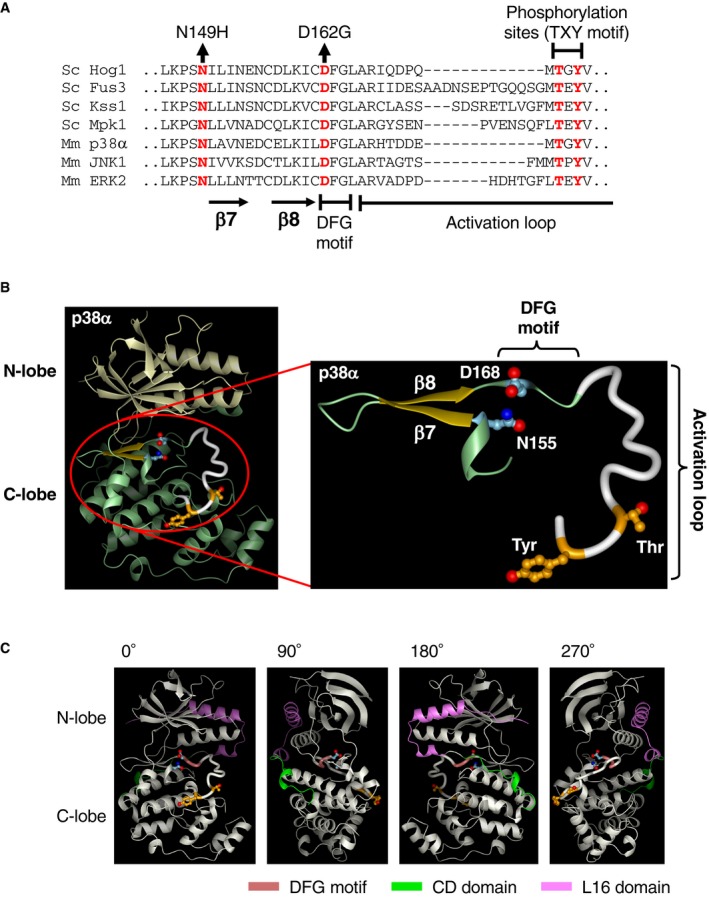
Figure EV4. Structural basis of the osmotic enhancement of Hog1 phosphorylation by Pbs2.

- Alignment of the amino acid sequences around the DFG motif of various MAP kinases. The positions of N149 and D162 in Hog1, the β7 and β8 strands, the DFG motif, the activation loop, and activating phosphorylation sites (the TXY motif) are indicated. The sequences of the mouse p38α and yeast Hog1 are highly conserved in this segment (23 residues out of 33 are identical, and the other residues show mostly conservative changes). Sc, Saccharomyces cerevisiae; Mm, Mus musculus (mouse).
- The 3D structure of the mouse p38α MAPK (left), and an annotated enlargement of the relevant segment (residues 151–183; right). The corresponding amino acid sequence is shown in (A). Side chains of N155, D168, and activating phosphorylation sites T180 and Y182 are also shown. N155 and D168 correspond to, respectively, the yeast Hog1 residues N149 and D162, whose mutations created the constitutively enhanced phenotype. The coordinate data were from PDB (ID 5UOJ) (Wang et al, 1997) and were visualized using the MOLMOL program (Koradi et al, 1996).
- The 3D structure of the mouse p38α MAPK showing the spatial relationship between the L16 domain and the DGF motif. Four side views of the mouse p38α are shown, each of which was rotated 90° from the previous one around the vertical axis. Following segments are highlighted by coloring: the DFG motif (brown), the CD domain (green), and the L16 domain (pink).
