-
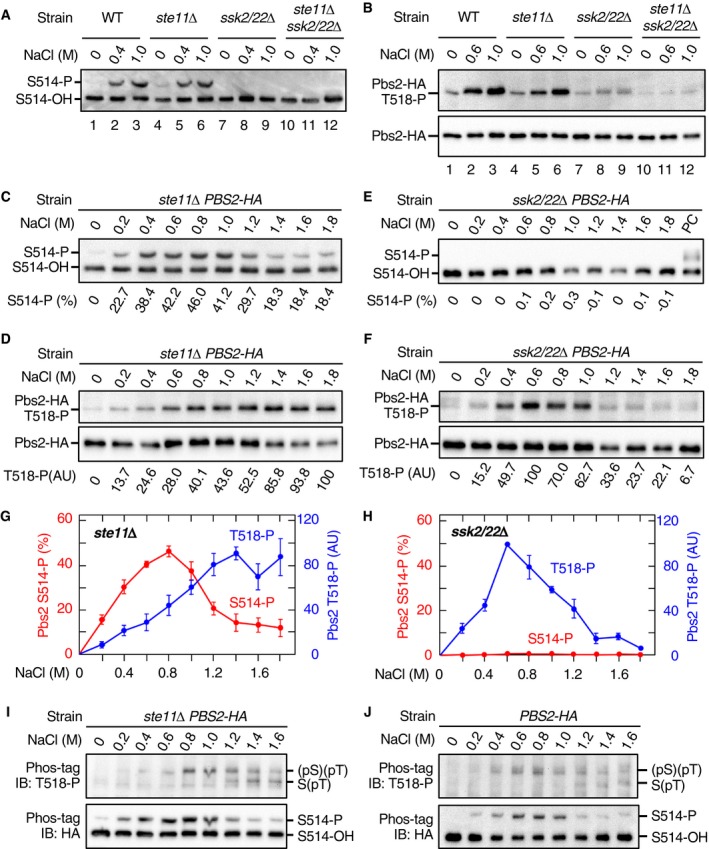
A, B
Detection of Pbs2 phosphorylation at S514 and T518. The yeast strains KT003 (pbs2Δ), KT005 (ste11Δ pbs2Δ), TM280 (ssk2/22Δ pbs2Δ), and KT043 (ste11Δ ssk2/22Δ pbs2Δ) were transformed with YCplac22I’‐Pbs2‐HA and were treated with the indicated concentrations of NaCl for 5 min. Pbs2‐HA was immunoprecipitated from cell extract, and phosphorylated Pbs2 was analyzed by (A) Phos‐tag band‐shift assay or (B) anti‐phospho‐T518 immunoblotting. In (A), the positions of Pbs2‐HA phosphorylated (S514‐P) and unphosphorylated (S514‐OH) at S514 are indicated.
-
C–F
NaCl dose–response analyses of Pbs2 phosphorylation. (C and D) KT005 (ste11Δ pbs2Δ) and (E and F) TM280 (ssk2/22Δ pbs2Δ) were transformed with YCplac22I’‐Pbs2‐HA and were treated with the indicated concentrations of NaCl for 5 min. (C and E) S514 phosphorylation was analyzed using the Phos‐tag band‐shift assay. PC; positive control. (D and F) T518 phosphorylation was analyzed using anti‐phospho‐T518 immunoblotting.
-
G, H
Average values of three independent experiments from (C and D) and (E and F), respectively, were plotted. AU, arbitrary unit.
-
I
Detection of di‐phosphorylated Pbs2. KT005 (ste11Δ pbs2Δ) transformed with YCplac22I’‐Pbs2‐HA was treated with the indicated concentrations of NaCl for 5 min. Pbs2‐HA was immunoprecipitated from cell extracts and subjected to Phos‐tag SDS–PAGE. Blots of these gels were probed with (upper panel) anti‐phospho‐T518 or (lower panel) anti‐HA.
-
J
Same as in (I), except that the yeast strain KT003 (pbs2Δ) was used.
Data information: (C–F) Representative results from three independent experiments. (G and H) Error bars are SEM (
= 3).

