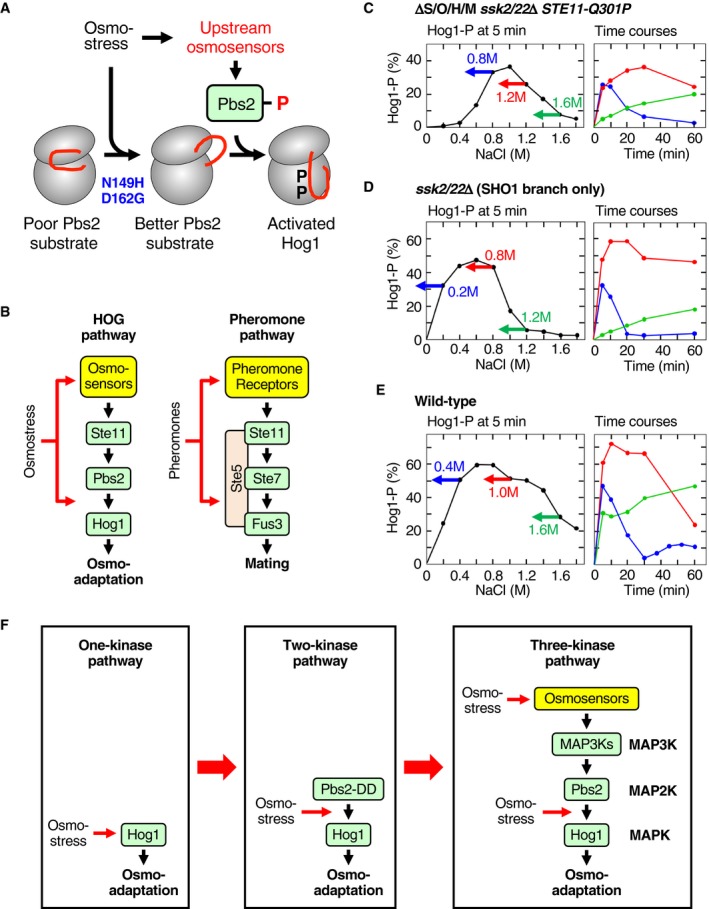
Figure EV5. Summary and hypothetical models.

-
AA hypothetical mechanism of the osmotic enhancement of the Pbs2‐Hog1 reaction. The first step is an osmotic conversion of Hog1 from a poor substrate of Pbs2 to a better substrate of Pbs2 and is mimicked by Hog1 N149H/D162G mutation. The second step is phosphorylation of the Hog1 activation loop by Pbs2. Two ovals represent the N‐ and C‐lobes of Hog1 kinase domain, and the red curve represents the activation loop.
-
BA schematic comparison of the HOG pathway and the pheromone pathway. In both pathways, the specific stimulus acts twice: first at the cell surface receptor/sensor, and second at the step of MAP2K‐MAPK reaction.
-
C–EThree modes of the Hog1 activation time courses are explained by negative and positive feedback regulations. In the left panels, the dose–response curves are taken from Fig 1I (error bars are omitted). Three colored arrows indicate the applied external NaCl osmolarities and symbolize the gradual decrease of effective osmostress with time. In the right panels, time courses at three NaCl concentrations are taken from Fig 9B–D, and shown by the same colors used in the corresponding left panels.
-
FHypothetical model of the evolutionary development of the three‐kinase MAPK cascades.
