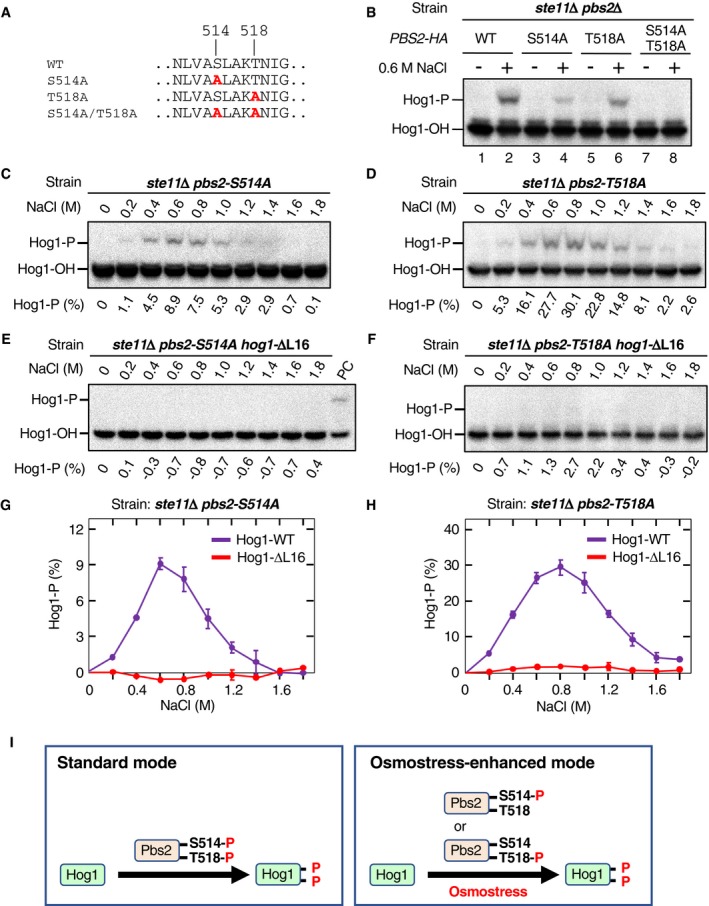
Figure 6. Mono‐phosphorylated Pbs2 can phosphorylate Hog1 only when the Pbs2‐Hog1 reaction is enhanced.

-
AThe Pbs2 single and double Ala substitution mutations used in this study.
-
BPhos‐tag band‐shift analyses of osmostress‐induced Hog1 phosphorylation. KT005 (ste11Δ pbs2Δ) was transformed with YCplac22I’‐Pbs2‐HA (WT) or its indicated mutant derivatives. Cells were stimulated with (+) or without (−) 0.6 M NaCl for 5 min.
-
C–FPhos‐tag band‐shift analyses of Hog1 phosphorylation. KT291 (ste11Δ pbs2Δ hog1Δ) was transformed with (C and D) pRS416‐Hog1 or (E and F) pRS416‐Hog1‐ΔL16, together with (C and E) YCplac22I’‐Pbs2‐S514A‐HA or (D and F) YCplac22I’‐Pbs2‐T518A‐HA. Cells were stimulated with the indicated concentrations of NaCl for 5 min.
-
G, HAverage values of three independent experiments from (C and E) and (D and F), respectively, are plotted.
-
IA scheme illustrating the osmotic enhancement of the Pbs2‐Hog1 reaction in activating Hog1 by mono‐phosphorylated Pbs2.
