-
A
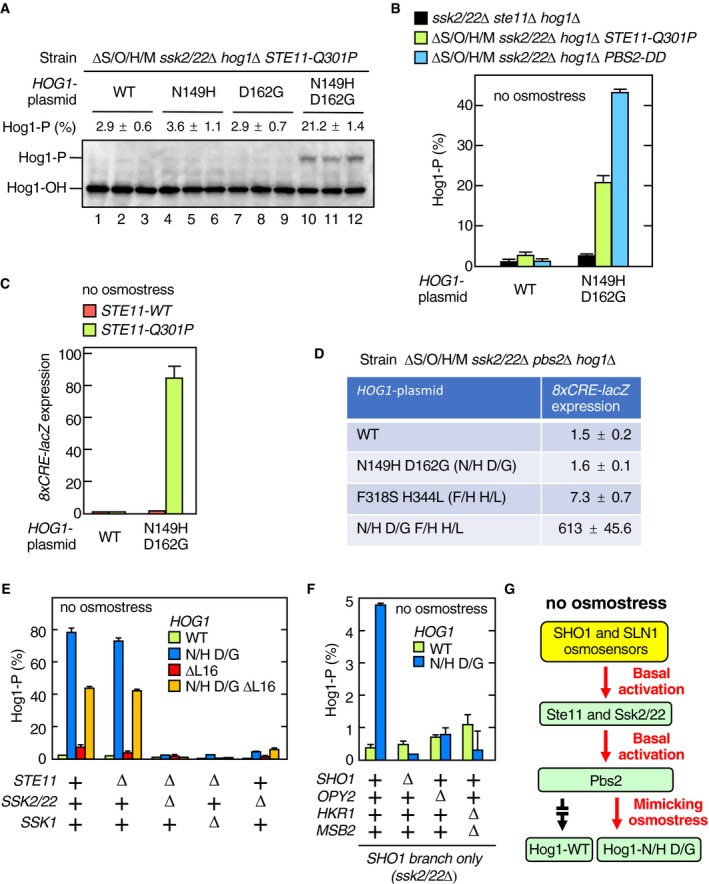
Phos‐tag band‐shift assay of Hog1 phosphorylation. KT235 (ΔS/O/H/M ssk2/22Δ hog1Δ STE11‐Q301P) was transformed with pRS416‐Hog1 (WT) or its indicated mutant derivatives. Cell extracts were prepared from fresh cultures without applying osmostress. For each HOG1 mutant plasmid, three independent cultures were assayed.
-
B
Same as in (A), except that the yeast strains KT260 (ssk2/22Δ ste11Δ hog1Δ), KT235 (ΔS/O/H/M ssk2/22Δ hog1Δ STE11‐Q301P), and KT248 (ΔS/O/H/M ssk2/22Δ hog1Δ pbs2Δ) carrying YCplac22I’‐Pbs2‐DD were used.
-
C
KT250 (ΔS/O/H/M ssk2/22Δ hog1Δ STE11‐WT) and KT235 (ΔS/O/H/M ssk2/22Δ hog1Δ STE11‐Q301P) were transformed with pRS416‐Hog1 (WT) or pRS416‐Hog1‐N149H D162G (N149H D162G) together with pRS414‐8xCRE‐lacZ. Expression of the Hog1 reporter gene 8xCRE‐lacZ in the absence of osmostress was assayed.
-
D
KT248 (ΔS/O/H/M ssk2/22Δ hog1Δ pbs2Δ) was transformed with pRS416‐Hog1 (WT) or its indicated mutant derivatives together with pRS414‐8xCRE‐lacZ. Expression of the Hog1 reporter gene 8xCRE‐lacZ in the absence of osmostress was assayed.
-
E, F
Phos‐tag band‐shift assay of Hog1 phosphorylation. Yeast strains of the indicated genotypes (shown below the graph) were transformed with pRS416‐Hog1 (WT) or its indicated mutant derivatives (shown inside the graph). Strain used were as follows: (E) FP4, KT259, KT260, KT292, and KY523; and (F) KY523, KT293, KT294, and KT295. N/H, N149H; D/G, D162G.
-
G
A schematic model showing that the lack of osmotic enhancement of the Pbs2‐Hog1 reaction prevents the basal Hog1 activation.
= 3). (C) Error bars are SEM (
= 4).

