-
A
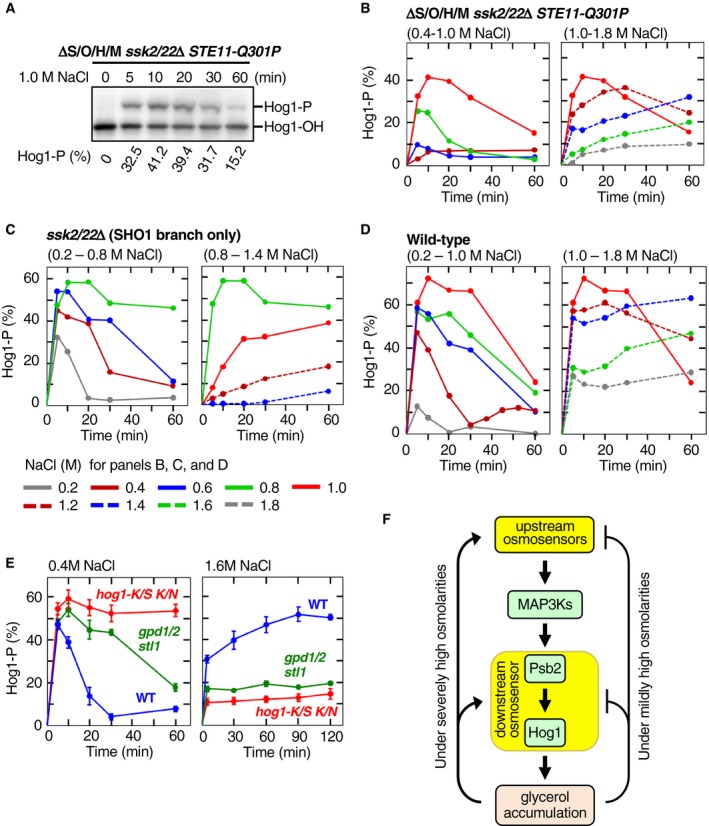
An example of the time‐course experiments for the osmostress‐induced Hog1 phosphorylation. The yeast strain KY603‐3 (ΔS/O/H/M ssk2/22Δ STE11‐Q301P) was stimulated with 1.0 M NaCl for the indicated times, and the percentage of phosphorylated Hog1 (Hog1‐P) was determined using a Phos‐tag band‐shift assay.
-
B–D
Compilations of the time courses of osmostress‐induced Hog1 activation in (B) KY603‐3 (ΔS/O/H/M ssk2/22Δ STE11‐Q301P), (C) TM257 (ssk2/22Δ), and (D) TM142 (wild‐type). For clarity, time‐course curves are shown in two panels for lower and higher ranges of NaCl concentrations. The color chart below (D) indicates the concentrations of NaCl used.
-
E
Effects of Hog1 kinase activity and osmostress‐induced glycerol accumulation on the time courses of Hog1 activation. Cells were stimulated with 0.4 M NaCl (left panel) or 1.6 M NaCl (right panel) for the indicated times, and the percentage of phosphorylated Hog1 was determined using Phos‐tag band‐shift assay. Strains used were as follows: TM142 (WT), KT254 (gpd1Δ gpd2Δ stl1Δ), and TM232 (hog1Δ) carrying pRS416‐HOG1‐K52S K53N. K/S K/N, K52S K53N; gpd1/2, gpd1Δ gpd2Δ.
-
F
A model of the negative and positive feedback regulations in the HOG pathway. The upstream osmosensors are Sln1 and the complexes composed of Sho1, Opy2, Hkr1, and Msb2. The molecular identity of the downstream osmosensor, which enhances the signaling between Pbs2 and Hog1, is currently unknown.
= 1 or more. (E) Error bars are SEM (
= 3 or more).

