-
A
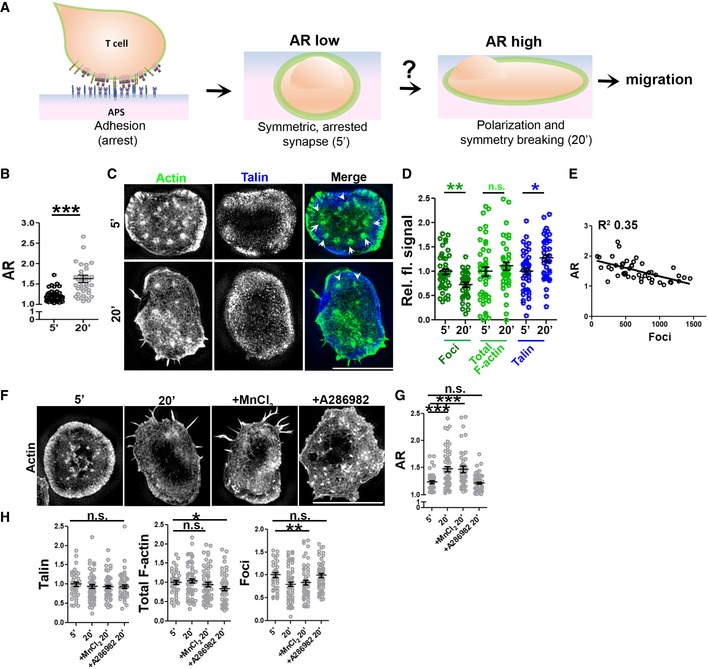
General schematic of the assay system used in this study for examining the process of synapse sustenance vs. polarization, post‐initial T‐cell adhesion, and spreading on the antigen‐presenting surface (APS). Cell–APS interface of T cells was imaged for synapse establishment and maturation (5′) and eventual symmetry breaking and polarization (20′).
-
B–D
T‐cell interface actin (phalloidin) re‐organization during synapse symmetry breaking, imaged using SIM. Quantification of the shape elongation (AR; B, n = 44 for 5′, 39 for 20′), or relative fluorescence signal of the indicated proteins in the SIM images (C, D) normalized to the mean of values at 5′; points represent values for individual cells. Arrowheads in (C) indicate foci. P values are: ***P < 0.0001 for AR, **P = 0.003 for foci, **P = 0.008 for talin, and P = 0.36 for total F‐actin using Mann–Whitney two‐tailed test between populations of cells within the same experiment.
-
E
Relationship between AR and foci at individual cell level, each point in the scatter plot represents value obtained from a single cell.
-
F–H
Integrin augmentation does not rescue synapse symmetry breaking. Cells were allowed to adhere to the APS for 5′ or 10′ and were then treated with vehicle control, 0.5 mM MnCl2, or 100 nM A286982 for subsequent 10′. Cells were fixed, stained with phalloidin and anti‐talin antibody, imaged using SIM (F), and analyzed for AR (G) as well as talin, total F‐actin, and actin foci at the synapse (H). In (E–H), n for 5′ = 40, for 20′ = 62, for MnCl2 = 59, for A286982 = 53. The values in the plots represent the intensity values normalized to the mean of 5′ in each set. P values in the graph, n.s. > 0.05; ***P < 0.001; *P = 0.01; **P < 0.009 using Mann–Whitney two‐tailed test between populations of cells within the same experiment.
Data information: Central values in the graphs represent Mean, and error bars represent ± SEM. These experiments were repeated at least thrice with similar results
Scale bar, 5 μm.

