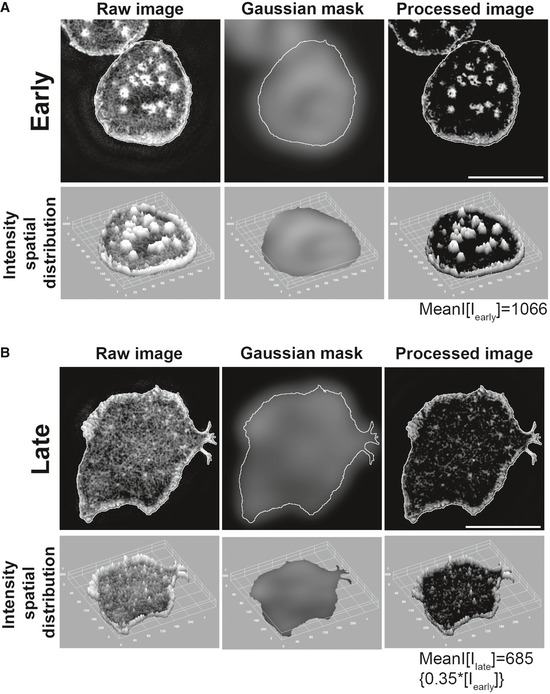
The images show 2D F‐actin intensity as marked by phalloidin staining (top images), or a 3D view of spatial distribution of intensities in the phalloidin images (bottom images). To process the raw images for extracting foci intensities from overall F‐actin signal, a Gaussian mask was generated by using a 1.6 × 1.6 μm rolling window, as optimized previously (Kumari
et al,
2015). Subtraction of mask image from raw image generated a processed image that could be quantified to measure the average intensity contributed by the foci. Note that while this method reliably identifies the foci in raw images and reduces intensity contribution from the non‐foci uniform lamellar area, the peripheral lamellipodial network still contributes a background of ˜ 35% to the total foci intensity, regardless of the presence of profuse foci in arrested synapse, or their visible reduction in the motile phase. Scale bar, 5 μm.

