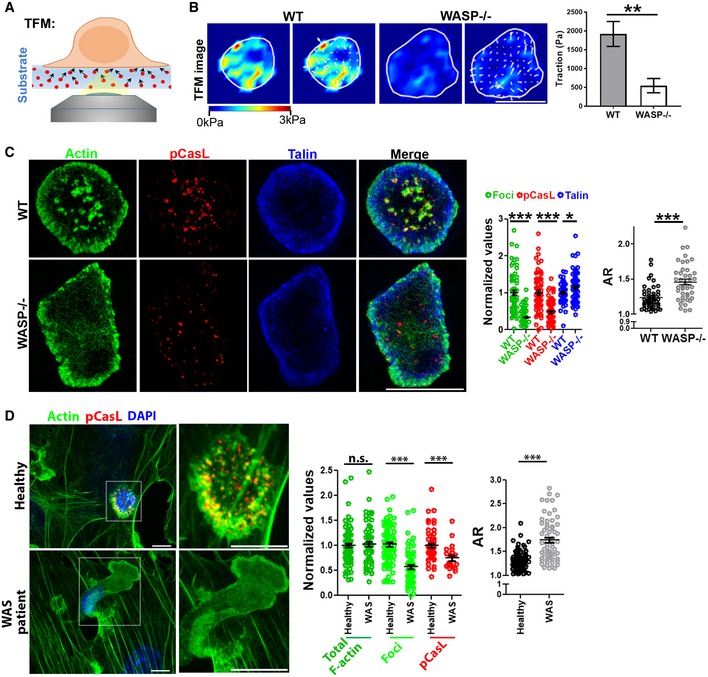
Figure 3. Foci‐associated mechanical forces are linked to synapse symmetry.

-
A , BActin foci‐deficient cells display poor traction forces in their synapse. WT or WASP−/− T cells were incubated on polyacrylamide substrates covalently functionalized with anti‐CD3 and ICAM1, and traction force measurements were carried out as described in “Materials and Methods”. The images in the right show traction force maps without (left panels) or with (right panels) force vectors. P value, **P < 0.005 as determined by using Mann–Whitney two‐tailed test between populations of cells within the same experiment, n = 9 and 11.
-
CSIM imaging of WT or WASP−/− T cells activated by APS for 5′. The graphs show quantification of actin foci (derived from phalloidin staining), pCasL, and talin levels in the synapse normalized to the “WT” mean value in each case (Middle graph; in the case of foci, n = 63 for WT and 86 for WASP−/−; in the case of pCasL n = 63 for WT and 78 for WASP−/−; in the case of talin, n = 59 for WT and 73 for WASP−/−; in the case of AR, n = 46 for WT and 42 for WASP−/−); right graph shows AR measurement. ***P < 0.0001; P value for talin *P = 0.07, as determined by using Mann–Whitney two‐tailed test between populations of cells within the same experiment.
-
DHuman WAS patient CD4+ T cells–APC conjugates display synapse symmetry defects similar to those observed in mouse WASP−/− CD4+ T cells. CD4+ T cells purified from healthy controls or WAS patients were incubated with superantigen‐loaded HUVEC cells for 5′ (APC; see “Materials and Methods”) and imaged using confocal microscopy. Each image represents a maximum intensity projection of the synaptic area. Graph in the middle shows values normalized to the mean value of the “Healthy” case. In the case of “actin” and “actin foci”, n = 87 for healthy and n = 63 for WAS; in the case of pCasL, n = 56 for healthy and n = 21 for WAS; and for “AR” graph, n = 88 for healthy and n = 63 for WAS case. P values; ***P < 0.001; n.s. P = 0.09, as determined by using Mann–Whitney two‐tailed test between populations of cells within the same experiment.
