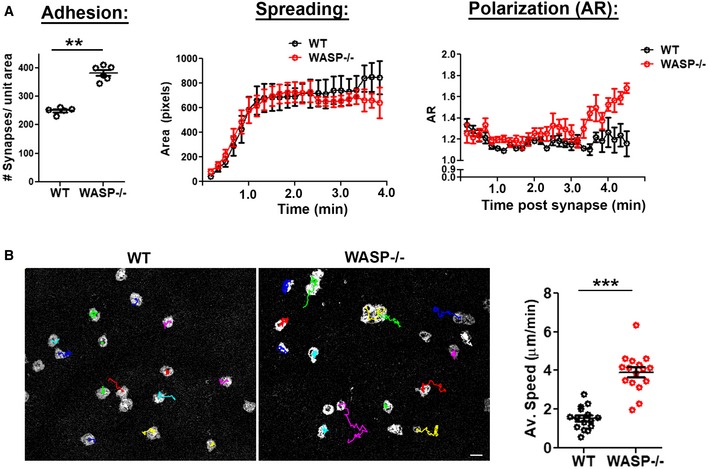
Figure EV3. Comparison of initial adhesion, spreading, and synapse stability in WT and WASP−/− cells. Related to Fig 3 .

-
A Initial adhesion and spreading kinetics are comparable in WASP−/− and WT T cells activated on APS, and WASP−/− cells however polarize their synapse at earlier time point (˜ 3 min) than the WT cells, **P = 0.004, measured using Mann–Whitney test. T cells were incubated with substrates on a temperature‐controlled microscope stage, imaged live using TIRFM (Movie EV5), and analyzed for spreading and shape elongation.
-
BSynapse breaking in WT and WASP−/− cells. Images are snapshots of T cells, taken from time‐lapse IRM images of T cells, and are overlaid with center‐of‐mass tracks (in color); the graph shows measured speed. ***P < 0.0001, measured using Mann–Whitney test. Scale bar, 5 μm.
