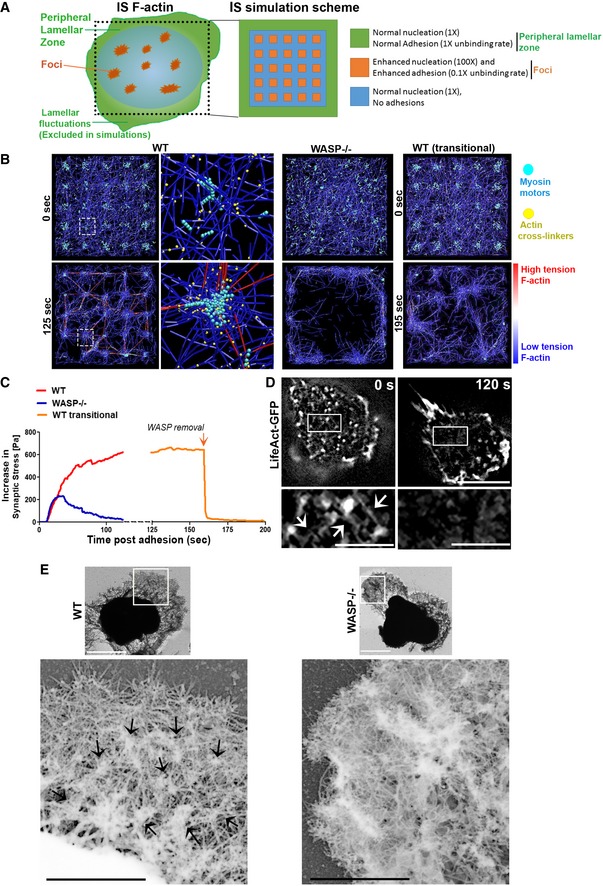
Figure 4. Computational simulations to explain the cytoskeletal basis of symmetry sustenance at synapse.

-
A Outline of the spatial scheme utilized to simulate synapse cytoskeletal dynamics. Cartoon on the left shows the spatial patterning of the two major actin networks: the lamellar F‐actin network in the peripheral zone that would continuously undergo fluctuations, and foci. The foci are interspersed throughout the synapse within a dynamic lamellar F‐actin network. The peripheral lamellar fluctuations seen in live imaging could not be included in the simulations due to unavailability of data on fresh boundary adhesions. The cartoon on the right shows square simulation space patterned after the cartoon on the left and utilized here for simulations. The actin nucleation and adhesion parameters used at the foci and lamellar zones are indicated on the right.
-
BSimulation of T cell IS F‐actin behavior and resultant mechanical tension incorporating the differential dynamics and positioning of foci and lamella across the synaptic interface, using Brownian dynamics equation with no inertia (see “Materials and Methods”). The images show simulation snapshots at the beginning (0 min; soon after the attachment and spreading of T cells on the substrates) and the end of the simulations for the three IS cases—with persistent foci (WT, left most panels), with no foci (WASP−/−, middle right panels), and with WASP and consequently foci downregulated after a period of synapse maturation (WT transitional). The colors in the images indicate myosin II motor (pseudocolored teal), F‐actin crosslinking proteins (pseudocolored yellow), and the F‐actin filaments (pseudocolored blue for the low tension and the red for thigh tension actin filaments); middle left image panels show the distribution of the aforementioned proteins at individual foci site at a higher magnification.
-
CPredicted stress (tension normalized to the area) profiles within the cytoskeletal architecture as the synaptic contact progresses in time, corresponding to the three cases shown in (D).
-
DLive imaging of a T cell using SIM shows the inter‐foci connections (arrows in the inset) as predicted in the simulations, and their loss concomitant with loss of actin foci, as the T cell polarizes to initiate motility (compare insets between 0 and 120 s). “0 s” refers to the beginning of the observation of the cell, after it has attached to the substrate, spread, and maintained synapse for 12 min. Scale bar, 5 μm in main images and 1.5 μm in the magnified insets.
-
EUltrastructural visualization of detergent extracted WT and WASP−/− T‐cell synaptic cytoskeleton using platinum replica electron microscopy (top images). Each image shows individual synapse, and dark zone in the middle of the synapse represents cell nucleus. Scale bar, 2.5 μm. The bottom left micrograph is the magnified inset from WT synapse and shows actin foci (identified as globular cluster of short filaments in the inset, marked with arrows)‐dependent interconnected cytoskeletal architecture that is associated with synapse symmetry as predicted in the model, and is lacking in the WASP−/− cell synapse (bottom right micrograph‐magnified inset from WASP−/− synapse). Scale bars, 1 μm. This experiment was repeated at least twice with similar results.
