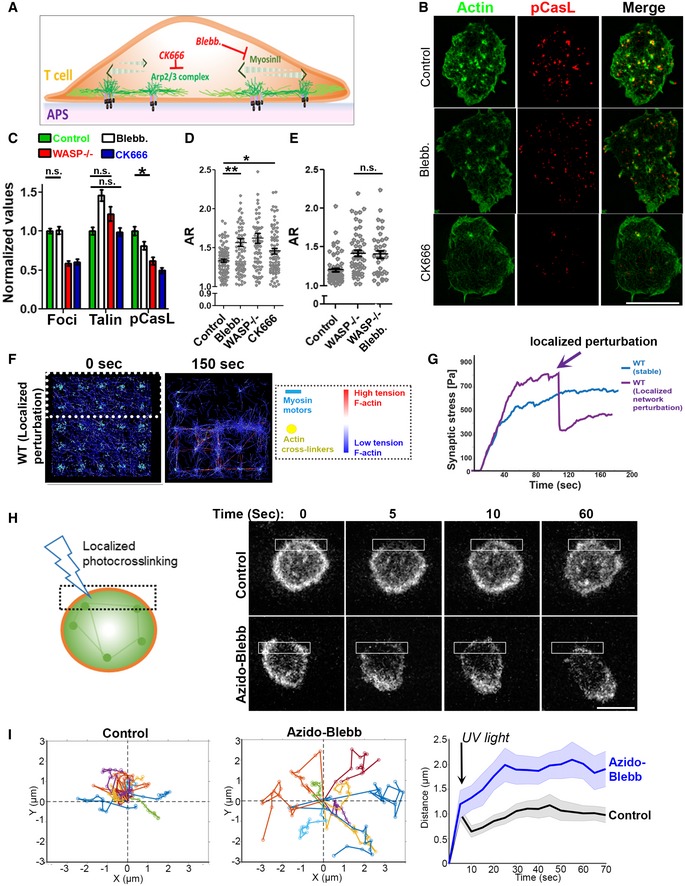
Figure 5. Pharmacological interrogation of actin foci–myosin crosstalk in sustaining symmetry.

-
A Schematic of the cytoskeletal inhibitors and their targets used in the experiments.
-
B–ESIM imaging of mouse T cells activated for 5′ on APS, then treated with the indicated inhibitors or vehicle control. Shown are the representative SIM images (B), and quantification of actin foci (from the phalloidin images), talin, or pCasL in the contact interface (normalized to the mean value in the control case, C), and measured cell morphology aspect ratios (D, E). Since CK666 treatment reduces F‐actin intensity (Kumari et al, 2015), the “actin” image of the CK666‐treated cell in (B) was contrasted differently than the “control” and “blebb.” cases for a clearer visualization of F‐actin. P values, *P = 0.02, **P = 0.001, n.s. > 0.05. For the rest of the comparisons between the control and treatment cases, P < 0.0001. For the bar graph in (B), n for foci groups are 214, 83, 92, and 98; for pCasL groups are 100, 68, 91, and 92; and for talin groups are 102, 70, 89, and 93, respectively. P value for the n.s. cases is > 0.05, *P = 0.02. In the foci, pCasL, and talin groups, when not indicated, the P values are < 0.0001 using Mann–Whitney two‐tailed test. Central values in the graphs represent Mean, and error bars represent ± SEM. These experiments were repeated at least thrice with similar results. Scale bar, 5 μm.
-
F, GSimulation of synaptic F‐actin network following localized myosin inactivation and inactivated myosin‐mediated F‐actin crosslinking within the area marked with dotted line in the left image. The graph shows the predicted alteration in mechanical stress profile, as myosin is inactivated crosslinked in the defined region (marked by an arrow), (G).
-
H, IExperimental confirmation of localized actomyosin crosslinking and symmetry breaking. LifeAct‐GFP‐expressing T cells were incubated with activating substrates and treated with vehicle control or 1 μM azido‐blebb and their contact interface imaged using low excitation laser power (0.5 mW), using a spinning disk confocal microscope (H). The montage shows the shape change and movement that synapse undergoes after it is exposed to a brief flash of blue light crosslinking azido‐blebb and actomyosin network within the illuminated area (shown with a box in the image). The deflection in center of mass (COM) within a minute was calculated and plotted for at least 10 cells in each case (graphs in I). The left graphs in (I) show individual COM trajectory, and the graph on the right shows average COM movement of cells within a minute post‐photo‐inactivation of myosin II. This experiment was repeated twice with similar results. Scale bar, 5 μm.
