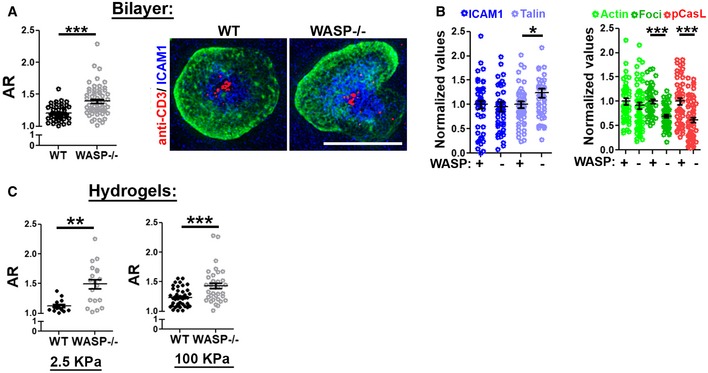
A , BT cells were activated using Alexa568‐2C11 and ICAM1 reconstituted lipid bilayers for 5 min, fixed, stained with phalloidin, and imaged using SIM. In the graph, n = 50 for WT and 61 for WASP−/−, P value, P*** < 0.0001, obtained using Mann–Whitney two‐tailed test. The graphs in (B) show synaptic levels of indicated proteins, normalized to the mean levels of “+WASP” in each case. For the left graph, n = 48, 46, 52, and 46, respectively, and P value, P* = 0.03. For the right graph, n = 50 for WT and n = 61 for WASP−/− in “actin”, “foci”, and “pCasL” cases. P values P*** < 0.0001, obtained using Mann–Whitney two‐tailed test.
CSynapse breaking behavior of T cells on hydrogels of indicated stiffness, covalently conjugated with 2C11 and ICAM1. These experiments were repeated at least thrice with similar results. In the left graph, n for WT = 14, for WASP−/−, n = 19; P** = 0.0015; in the graph on the right, n for WT = 40, n for WASP−/− = 36, P*** = 0.0006, as assessed using Mann–Whitney two‐tailed test.

