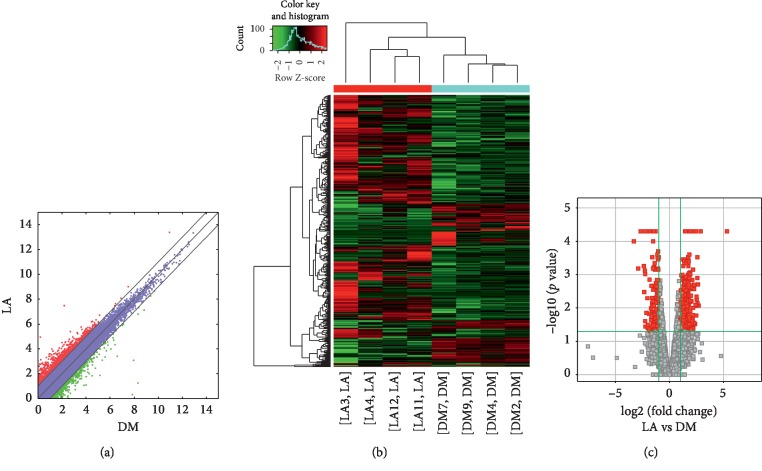
Figure 8.
Changes in the mRNA expression profiles of the LADA and T2DM groups. (a) The scatter plot reveals that a significant difference existed in the distribution of mRNAs between the LADA group and the T2DM group. (b) The heat map depicts the hierarchical clustering of altered mRNAs in the LADA group compared to the T2DM group. Red represents upregulation, while green represents downregulation. (c) The volcanic map displays the upregulated and downregulated mRNAs in the LADA group compared to the T2DM group. LADA—latent autoimmune diabetes in adults; T2DM—type 2 diabetes mellitus; mRNAs—messenger RNAs.

