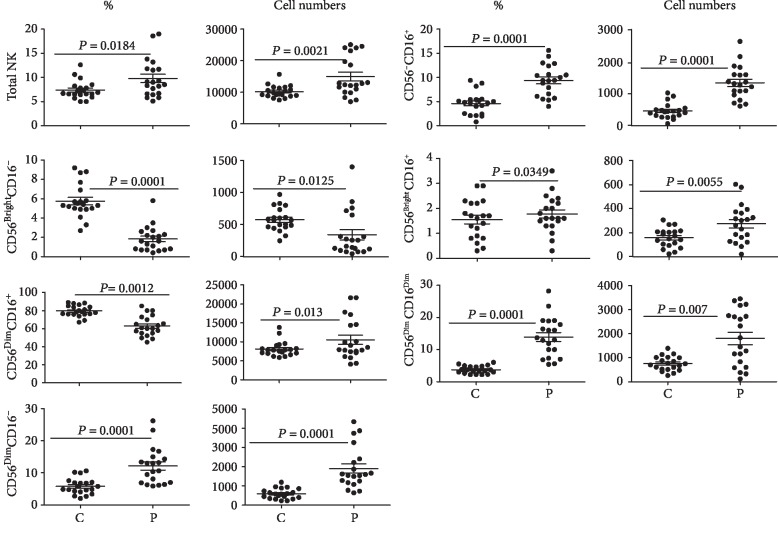
Figure 1.
Percentages and absolute numbers of NK cells and their subsets. The figure shows percentages and absolute numbers (per ml) of the peripheral blood NK cells and their subsets (with respect to the expression of CD16 and CD56) in 20 CD patients (P) vis-à-vis 20 healthy control subjects (C). The figure shows means ± SE, individual data points, and p values.

