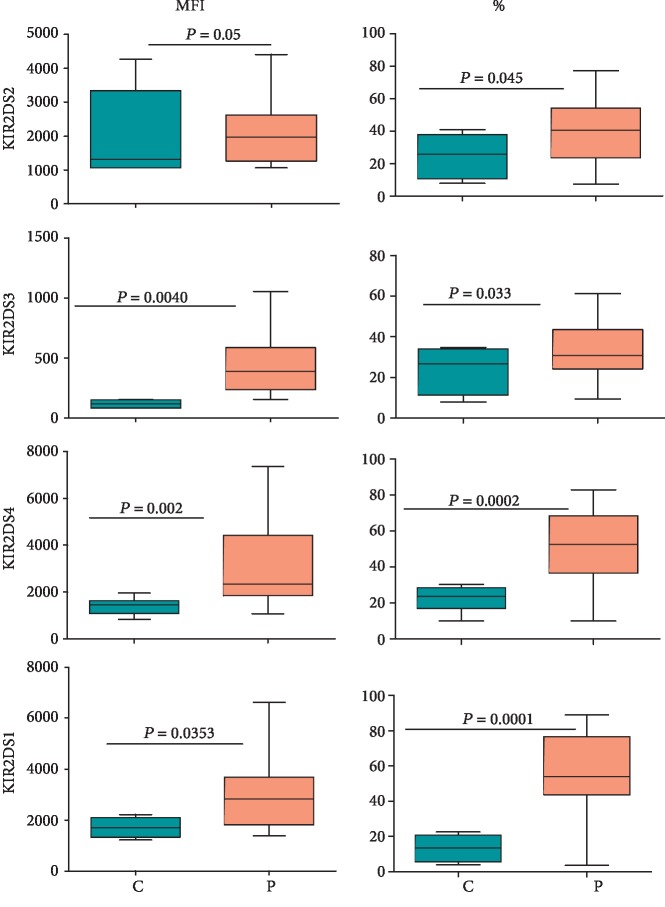
Figure 2.
Expression of activating KIR on NK cells in CD patients and healthy controls. Fifty microliters of blood samples was used and stained for CD3, CD14, and CD19 and activating KIR (PE or FITC-conjugated) as described in Materials and Methods. The expression was determined on CD3-CD14-CD19-CD56bright/dim (NK) cells. The figure shows mean fluorescence intensities (MFIs) and percentages of NK cells expressing the receptor from 15 treatment-naïve patients and 20 healthy controls. Each box and whisker plot indicates median, upper and lower values, interquartile range, and p values.

